
This blog post is a somewhat early Q3 review of the UK Dividend Stocks Model Portfolio (which holds exactly the same stocks as my real-world portfolio).
I’ll start off with a very quick look at the portfolio’s goals and strategy, and then dive into its performance so far versus the FTSE All-Share. I’ll then outline the main adjustments I’ve made to the portfolio and what the outlook is for the overall UK stock market.
What's in this review
- Investment goals and strategy
- The best year-to-date performance in the portfolio’s history
- High but not extreme total returns
- Dividend yields have yet to recover
- Tweaking the portfolio to make it better
- The UK market is close to fair value so expected future returns are close to normal
- 2021 has been a good year overall and the future still looks bright
Investment goals and strategy
The portfolio’s goals are pretty standard for a UK income and growth portfolio:
-
High yield:
-
At a minimum, have a higher dividend yield than the FTSE All-Share
-
Preferably, have a dividend yield of more than 5%
-
-
High total return (measured over at least five years):
-
At a minimum, have a higher total return than the FTSE All-Share
-
Preferably, have a total return of more than 10% per year on average
-
-
Low risk:
-
Suffer smaller declines than the FTSE All-Share in down years
-
Note: When I say “FTSE All-Share” I’m actually referring to a low-cost index tracker rather than the actual index. Benchmarking your results against a tracker fund is more realistic because you can’t invest in the actual index.
There are lots of different ways to achieve those goals, but my approach is to follow this three-step investment strategy:
-
Own quality dividend stocks
-
Own them at attractive valuations
-
Own a concentrated and diverse portfolio
I’ll have a lot more to say on that strategy in future blog posts, but for now, that should give you a rough idea of how I invest.
Okay, that’s enough background information. Let’s take a look at how 2021 has panned out so far.
The best year-to-date performance in the portfolio’s history
As investors have become more confident over the last year or so they have been more willing to buy riskier assets like shares. That surge in demand has helped push prices up and, as a result, stocks have generally produced very good returns.
High but not extreme total returns
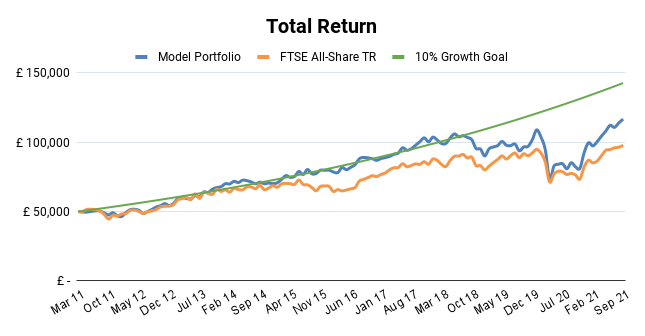
By the start of September, the FTSE All-Share had produced a total return of 12.4%, which is well above its average return of around 7%.
The model portfolio has done somewhat better, with a total return so far of 17.4%. This is also well above the portfolio’s average return since 2011 of 9% per year.
For context, here’s a total return chart for both the model portfolio and its All-Share benchmark going back to 2011 (versus my 10% annualised return target):
As always, that 17.4% return is made up of widely varying returns across the portfolio’s holdings.
For example, Senior, a leading aerospace engineering firm, has been the biggest short-term winner. It’s up 98% year-to-date after crashing in 2020 as the aviation industry almost came to a complete stop.
On the downside (there’s always a downside), the biggest short-term loser has been Telecom Plus, down 27% year-to-date. This is probably due to fears around increasing price regulation in the utility sector.
Overall then, 2021 has produced good returns, but they’re not crazy. They’re the sort of thing you should expect to see when the stock market is recovering from a fairly major crash, as we had in 2020.
Of course, I don’t expect strong double-digit returns to occur all that often, but I’m not going to complain when they do.
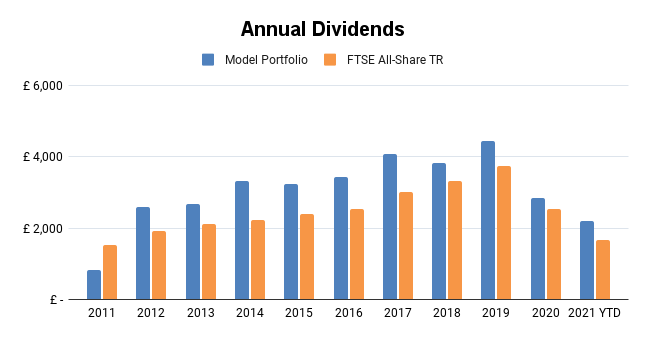
Dividend yields have yet to recover
Less positively, the dividend yields of both the FTSE All-Share and model portfolio have yet to recover to any meaningful degree.
Yes, many companies that suspended their dividends during the pandemic have reinstated them, but dividends are mostly paid twice each year so this recovery has yet to flow through into actual dividend payments.
Because of that, the dividend yield on the FTSE All-Share in September was 2.6% and the model portfolio’s yield was only fractionally better at 2.8%.
Historically, the All-Share’s yield has been closer to 3% and the model portfolio’s yield closer to 4%, so as I’ve said, both have yet to recover fully.
So when will that full recovery take place?
If I look at the forecast dividend for each of the portfolio’s holdings and multiply it by each holding’s position size, it’s possible to come up with an estimate for next year’s dividend. And on that basis, the portfolio’s estimated forward yield (i.e. next year’s estimated dividend relative to the portfolio’s current value) is 3.8%.
That would give the portfolio a decent dividend yield and, more importantly, the cash value of the dividend would equal the portfolio’s record dividend from 2019. So it seems that a full recovery of dividends over the next year is very likely.
Again, for context, here are a couple of charts showing dividend yields and absolute dividends paid (all of which are reinvested) for both the model portfolio and its All-Share benchmark (note that the 5% yield goal was only added in 2021): 
Tweaking the portfolio to make it better
I am not what you’d call a high-frequency trader. Instead, I tend to hold companies for years rather than months and I almost never buy or sell more than one company in any given month.
However, I am not a buy-and-hold-forever investor, so I do make minor adjustments to the portfolio to improve the quality of its holdings, its yield and its expected return.
Over the last year or so I’ve set myself two main tasks, both of which should produce a more concentrated portfolio of higher quality, higher yield shares.
Task 1: Reduce the number of holdings
In 2020 I made the mistake of loading up on lots of attractively valued stocks after the market crash. Many of these investments have worked out quite well, but it was still a mistake because the portfolio ended up with 34 holdings.
That may not sound like a lot, given that the FTSE 100 contains 100 companies, but given the depth of research I like to do, there weren’t enough hours in the day to keep on top of them all.
So after an extensive period of reading, thinking, and then more reading, I came to the conclusion that the portfolio could be both improved and made easier to manage if I sold off the least attractive holdings and re-focused it around its best holdings.
That was at the start of 2021, and since then I’ve sold eight holdings and added one new position. That’s taken the portfolio from 34 to 27 holdings and by the end of the year, I expect it to be around 25 holdings.
The eight holdings I sold were mostly legacy holdings, purchased years ago when I was less focused on owning quality companies.
If you’re interested, here are all the pre-sale reviews:
-
January: Selling Hyve (PDF)
-
February: Selling N Brown (PDF)
-
March: Selling Mitie (PDF)
-
April: Selling Standard Life Aberdeen (PDF)
-
May: Selling Petrofac (PDF)
-
June: Selling XP Power (PDF)
-
August: Selling Burberry
-
September: Selling PayPoint (blog post coming next week)
Task 2: Tilt the portfolio towards its best holdings
When you remove the least attractive holdings from a portfolio, the remaining holdings will of course be more attractive, on average.
You can take this a step further by actively managing position sizes. In other words, actively increasing the size of the most attractive investments and actively reducing the size of the least attractive.
Again, I’m not a high-frequency trader, so I only make one or two of these adjustments, at most, each month. So far that seems to be enough to keep most positions within 1% or so of their target size.
I’ll explain how I calculate that target size in a later blog post, but for now, I’ll just say that it’s based on a combination of each holdings quality, defensiveness and valuation.
Here’s an example of adjusting position sizes based on valuation:
Let’s say the model portfolio holds Legal & General, because it does. Let’s also say that L&G has both a target and an actual position size of 4%. Now let’s say that L&G’s share price falls by 50% because investors fear the pandemic will have a big impact because L&G is categorised as a life insurer (pandemics are typically not great for life insurers).
Because L&G’s share price has fallen by 50%, its actual position size has fallen from 4% to 2%. Because of this abrupt decline, I review L&G’s investment case and come to the conclusion that the pandemic is very likely to have no material impact on the company or its expected dividends.
If the company’s expected dividends are unchanged, then a 50% lower share price must make those shares more attractive than they were before. After all, the expected dividend growth rate is the same but the yield is now twice what it was before (halving the share price doubles the yield).
And if the shares are more attractive than before then L&G’s target position size should increase. Remember, my aim now is to invest more into the most attractive situations.
Let’s say L&G’s target position size has increased from 4% to 6%. Its actual size is now 2%, so there’s a big gap between the actual size of 2% and the target size of 6%.
In that case, it makes sense to top up L&G so that it’s closer to its target position size, and that’s exactly what I’ve been doing in recent months with L&G and several other holdings.
To show you what that looks like, here’s a chart of the portfolio’s holdings, sorted by their actual position sizes. These position sizes have, for the most part, been deliberately chosen to improve the portfolio, rather than being the result of random share price movements.
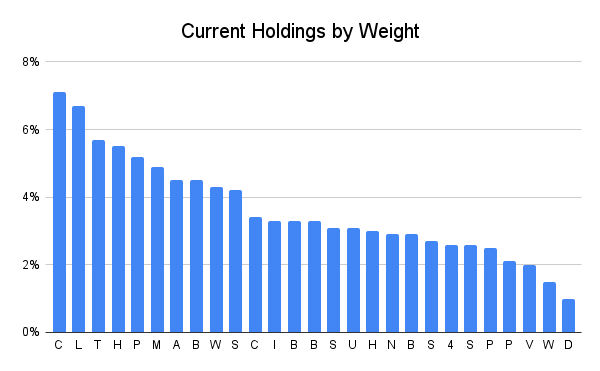
I think a couple of final points are worth mentioning:
-
Only two positions are less than 2%, so almost all holdings are contributing meaningfully to performance
-
The top 10 holdings make up just over 50% of the portfolio and, as far as I can tell, these are all high-quality businesses trading at very attractive valuations
Of course, you have to be careful with how far you take this sort of thing. There is a risk that you’ll end up with too much invested in too few companies. To avoid that, I have a hard rule that any position exceeding 10% must be trimmed back to less than 8% regardless of how attractive it seems.
There’s also a risk with topping up holdings where the price has fallen. There’s a risk of “averaging down to doom” as a reader said to me recently, where you repeatedly top up a holding, eventually sinking huge sums into it, only to see it all go up in smoke when the stock goes to zero.
That is a risk, but it isn’t a risk if you limit how much cash you invest into any single holding. The amount you’ve invested into a company is known as the “book value” of the investment, rather than its “market value”. Again, I think limiting the “book value” of all holdings to less than 10% of the portfolio’s current value is a sensible limit for most investors.
In other words, if a holding’s book value is more than 10% of the overall portfolio’s value, then no matter how attractive it becomes, I won’t top it up any more until that percentage falls below 8%.
Okay, that's enough about portfolio management, let’s look at the overall market's valuation to see how it might fair after such a positive year so far.
The UK market is close to fair value so expected future returns are close to normal
Most people get excited when they see asset prices rising, whether it’s stocks, property or Bitcoin. In reality, rapid price rises are usually bad for future returns, so let’s have a look at how the FTSE 100 and FTSE 250 compare to their historical valuation norms.
The FTSE 100 is at fair value according to its CAPE ratio
I’ll do a more detailed review of the UK market’s valuation levels in a future blog post. For now, I’ll just say that the FTSE 100, at 7,104, has a CAPE ratio (cyclically adjusted PE) of 16, which matches its estimated long-term average almost perfectly.
So despite a good performance in 2021 so far, there are no signs that UK large caps are, as a group, overvalued.
On that basis, it’s reasonable to assume historically average returns going forwards, which means something in the region of 7% per year on average.
The FTSE 250 has been setting record highs but is not obviously overvalued
The FTSE 250 has materially outperformed the FTSE 100 so far this year, with returns of 17% to date more or less matching the return of my model portfolio. And that’s without dividends. The FTSE 250 total return index is up almost 20%, so mid-caps have really had an exceptional year overall.
The FTSE 250’s average CAPE over the last 30 years is about 22, so comfortably higher than the FTSE 100. Even so, its CAPE ratio today is over 26.4, which is 20% above “fair value”.
But in reality that isn’t very much, and an index needs to be 100% overvalued before I’d say it’s in bubble territory (which is a fair description of the S&P 500). So for now, I would say that the FTSE 250 is perhaps very slightly expensive, but well within normal levels.
2021 has been a good year overall and the future still looks bright
In summary, the model portfolio has had an extremely good year so far, much of which is down to the generally very positive returns from the overall UK stock market.
I’ve spent most of the year removing most of the weak holdings from the portfolio while increasing the position sizes of its most attractive holdings.
And the UK market still doesn’t seem to be overvalued, despite a so far very successful 2021.
Overall, I’m hopeful that the UK market can finally string a few good years together, after a pretty dismal showing since the start of 2018.
And finally, although it is useful and interesting and perhaps even fun to pick apart your portfolio’s short-term performance, in the long run, a single good or bad year rarely matters very much.
What matters is that you follow a sensible approach, consistently applied over many years, and don’t get overly concerned about short-term ups and downs.
No time for spreadsheets or annual reports?
If you like this article but don’t have hours each month to dig through company accounts, you might find my monthly investment newsletter useful.
Once a month I send out a plain‑English PDF showing:
- The full UK dividend stocks model portfolio
- Which shares I’m buying, selling, trimming or topping up
- The latest news and trading updates for each holding
- Where we are in the stock market valuation cycle
All designed so a UK investor can stay on top of their dividend portfolio in well under an hour a month.
Get the latest blog posts & a free checklist
Get my latest articles in (at most) one email per week and download my dividend investing checklist. Topics usually include:
- Detailed reviews of high-quality UK dividend stocks
- Updates on my UK dividend stocks portfolio
- FTSE 100 and FTSE 250 valuations
- "How to" articles covering all aspects of dividend investing
No spam. Unsubscribe anytime.