
The FTSE 250 fell by 20% in 2022 and it's down 22% from its mid-2021 high, so the UK mid-cap index is definitely in a bear market.
Of course, this isn’t exactly surprising as the economic backdrop in the UK has zigged and zagged between negative and borderline catastrophic for much of the year.
For some investors, a 20% decline is enough to drive them out of the stock market and into the perceived safety of cash, but most experienced investors know that a bear market can in fact be a golden opportunity to buy high-quality stocks at knock-down prices.
So, has this bear market made the FTSE 250 cheap and, if it has, what implications does that have for potential future returns?
Table of Contents
- How did the FTSE 250 perform in 2022?
- Is the FTSE 250's CAPE valuation high or low?
- My FTSE 250 forecast for 2023
- My FTSE 250 forecast for the next ten years
How did the FTSE 250 perform in 2022?
The FTSE 250 started 2022 at 23,481 and ended the year at 18,853, so across the year as a whole it declined by 19.7%. Compare that to the FTSE 100’s world-beating 1% gain in 2022 and you can see that the two main UK indices have produced vastly different results over the last 12 months.
To see what that looks like, the chart below compares the FTSE 250 (in black) to the FTSE 100 (in blue) over the last year.
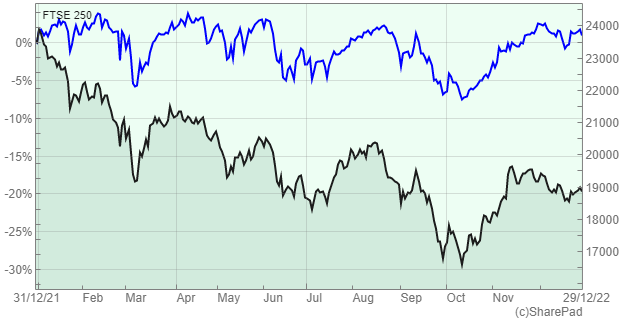
It may seem as if the FTSE 250 put in a particularly bad performance in 2022, but that isn’t true. Instead, the FTSE 100's 1% gain was the exception rather than the norm and most of the world's major indices saw double-digit declines.
In my recent FTSE 100 forecast, I said that the FTSE 100 had essentially been lucky by being weighted towards the right sectors (healthcare, energy and natural resources) at the right time (when those sectors were benefitting from a pandemic and/or a war in Europe). As a quick example of this, more than 15% of the FTSE 100 is invested in AstraZeneca and Shell, both of which saw their share price gain more than 30% in 2022 (adding several percentage points to the FTSE 100's total return).
The FTSE 250 wasn’t so lucky.
For one thing, it isn’t anywhere near as concentrated as the FTSE 100 and it doesn’t have any holdings with position sizes above 2%. This is good because it makes the FTSE 250 very diversified, but it’s bad because it means the index doesn’t really benefit when a handful of key holdings have an exceptionally good year.
It also didn’t benefit from favourable sector weightings, with the three largest FTSE 250 sectors being financials (44%), industrials (16%) and consumer discretionary stocks (14%). The weighting towards financials is a bit of a misnomer because most of that 44% is made up of investment trusts, which are in turn invested in real estate, US tech stocks, gold mining companies and who knows what else. Either way, financials, industrials and consumer discretionary stocks are all cyclical and none of them had anything special to gain from a pandemic or European war.
So, the FTSE 250 wasn't particularly lucky in 2022 and as a result, it fell into a bear market, as did many of its peers. But as I've already mentioned, bear markets can be good for long-term investors because they increase the number of bargain stocks, so where has this bear market left the FTSE 250's valuation?
Is the FTSE 250's CAPE valuation high or low?
My go-to metric for valuing stock market indices is the well-known cyclically adjusted PE ratio (or CAPE for short), which was popularised by Robert Shiller and his book, Irrational Exuberance.
When that book was published in early 2000, Shiller used CAPE to argue that the S&P 500 was in the middle of a gigantic bubble (the dot-com bubble). He was right and just a few months after the book was published, the bubble burst. That is perhaps the best single example of CAPE's ability to identify extremely overvalued markets (and it's just as good at spotting extremely undervalued markets).
The CAPE ratio is very similar to the standard price/earnings ratio (PE), but instead of comparing price to a single year’s earnings (as is the case with the PE ratio) it compares price to the index’s average earnings of the last ten year, adjusted for inflation. This makes CAPE a much more reliable valuation metric because it's relatively unaffected by the ups and downs of earnings over a single year.
At the end of 2022, the FTSE 250's CAPE ratio was 18.7. Over the last 30 years, CAPE has had an average value of 25, so the FTSE 250's current valuation is comfortably below average.
This tells us that the FTSE 250 is probably cheap, but it doesn't tell us whether the FTSE 250 is really cheap, or only slightly cheap. To understand the degree of cheapness in more detail, we can look once again to the historical record.
We have CAPE data for the FTSE 250, the FTSE 100 and the S&P 500 covering the best part of two centuries in total, so we have a pretty good idea of the sort of values CAPE usually takes. And that long history tells us that CAPE spends virtually all of its time in a range between about half its long-run average to about double its long-run average.
In the FTSE 250's case, that means we should expect CAPE to almost always be between half of 25 and double 25. To err on the side of caution and to make the maths a bit easier, I'm going to assume that the FTSE 250's long-run average CAPE is 24, which means we should expect CAPE to almost always be between 12 and 48. And that is exactly what we see in the data.
To help you visualise all of this, here's a chart showing the FTSE 250's price and where it's CAPE sits within the normal half-to-double range.

If you haven’t seen this type of chart before, here’s the same chart with a more descriptive colour-coding key.

The key point to remember is this:
- Low valuations lead to high future returns and high valuations lead to low future returns
For example, the chart above shows that the FTSE 250 fell into the light green “cheap zone” during the bear market of 2002 and returns from that low point were very good. Even more dramatically, the FTSE 250 just managed to enter the dark green “depression zone” during the dark days of 2009 and, from that point of maximum fear, returns have been exceptional.
On the other hand, in 2006 the FTSE 250 was riding high and almost reached the light red “very expensive” zone. That optimism was soon obliterated by the 2008/2009 crash and even though the market has rebounded since 2009, overall returns from 2006 to 2022 have been weak.
Similar stories punctuate almost two centuries of CAPE data across multiple indices, so CAPE has a long and distinguished history of identifying very expensive and very cheap markets.
In terms of the FTSE 250’s current CAPE of 18.7, you can see that the index is now well into the green "cheap" zone and appears to be heading towards the darker green "very cheap" zone. History suggests that we could see strong multi-year returns from today's relatively low valuation, but how strong might those returns be?
My FTSE 250 forecast for 2023
Of course, nobody can predict the stock market’s future with certainty, but we can use the mean-reverting nature of CAPE to make a sensibly tentative forecast for where the index might be at the end of 2023.
By mean-reverting, I mean that historically, CAPE has always returned to average (fair) valuation levels, no matter how high or low it gets taken by overly optimistic or overly pessimistic investors. Eventually the piper must be paid and eventually CAPE has always reverted to the mean.
One simple and reasonable assumption then, is that the FTSE 250 and its CAPE ratio will be somewhere within my fair value zone (where CAPE is between 21 and 30) at the end of 2023.
With the FTSE 250 at 18,853 at the end of 2022 and its CAPE ratio at 18.7, it's easy to work out where the index would be if CAPE was 21 or 30, so it's easy to make a reasonable one-year forecast:
- If the FTSE 250 ends 2023 close to fair value it will be between 21,100 and 30,200
In terms of gains or losses, that means:
- If the FTSE 250 ends 2023 at the upper end of fair value (30,200) it will gain 60%
- If the FTSE 250 ends 2023 and the lower end of fair value (21,100) it will gain 12%
As you can see, a return to anywhere near fair value would result in a very solid positive return for the FTSE 250. Whether or not that actually happens is another matter, but fair value is like gravity; it pulls the FTSE 250 towards it and at least we can see which direction "gravity" is pulling (upwards, in this case).
On that basis, this bear market could be a good buying opportunity, but long-term investors should really focus on long-term results rather than short-term results, so here’s a CAPE-based forecast for the next ten years.
My FTSE 250 forecast for the next ten years
As I said in my recent FTSE 100 forecast, when we’re trying to work out where an index might be in ten years, earnings growth becomes a significant factor (unlike over one year, where earnings growth is almost irrelevant).
Over the last 30 years, the FTSE 250’s cyclically adjusted earnings have grown by a very impressive 4.5% per year ahead of inflation. That is shockingly better than the measly 1.5% real earnings growth rate managed by the FTSE 100 since 1987.
Given that we can't really know what's going to happen over the next ten years, I think it's reasonable to assume that the FTSE 250's earnings will continue to grow at their historically average rate of inflation plus 4.5%.
If we also assume (perhaps somewhat optimistically) that the Bank of England manages to keep UK inflation at its 2% target, then we end up with a forecast for earnings growth of 6.5% per year.
If the FTSE 250 does manage to grow earnings that quickly then its cyclically adjusted earnings will grow from 1,007 today to 1,890 by the end of 2032 (those figures are in index points, not millions or billions of pounds).
Remember that CAPE is mean-reverting, so I still think it’s sensible to assume that the FTSE 250 is in the fair value zone (where CAPE is between 21 and 30) at the end of 2032.
If we combine those assumptions about earnings growth and future CAPE values, we get the following ten-year forecast:
- If the FTSE 250 is close to fair value in ten years it will be between 39,700 and 56,700
In percentage terms, that means:
- If the FTSE 250 is at the upper end of fair value (56,700) in ten years it will have increased by 200%
- If the FTSE 250 is at the lower end of fair value (39,700) in ten years it will have increased by 110%
In layman's terms, my forecast says there's a good chance the FTSE 250 will either double or triple over the next ten years. That may seem ludicrously optimistic given that we’re in the middle of a bear market, but history suggests that it is not.
Last but not least, here's a total return forecast (capital gain plus dividend income) for the next ten years.
At the end of 2022, the FTSE 250's dividend yield was 3.2%. If we assume that dividends grow in line with earnings (at our forecast rate of 6.5% per year) then we end up with the following total return forecasts:
- If the FTSE 250 is at the upper end of fair value (56,700) in ten years it will have generated annualised total returns of 14.4%
- If the FTSE 250 is at the lower end of fair value (39,700) in ten years it will have generated annualised total returns of 11.0%
An annualised total return of 11% is very good and 14.4% is of course even better. So, this forecast is saying that if the FTSE 250 can continue to grow its earnings as quickly as it has over the last 30 years, then this bear market could be a solid buying opportunity for long-term investors.
Some will say that an estimated earnings growth rate of 6.5% is too high, and they could be right. But let's not forget that the FTSE 250 tripled between 2009 and 2017, so perhaps a doubling or tripling over the next decade isn't such a crazy forecast after all.
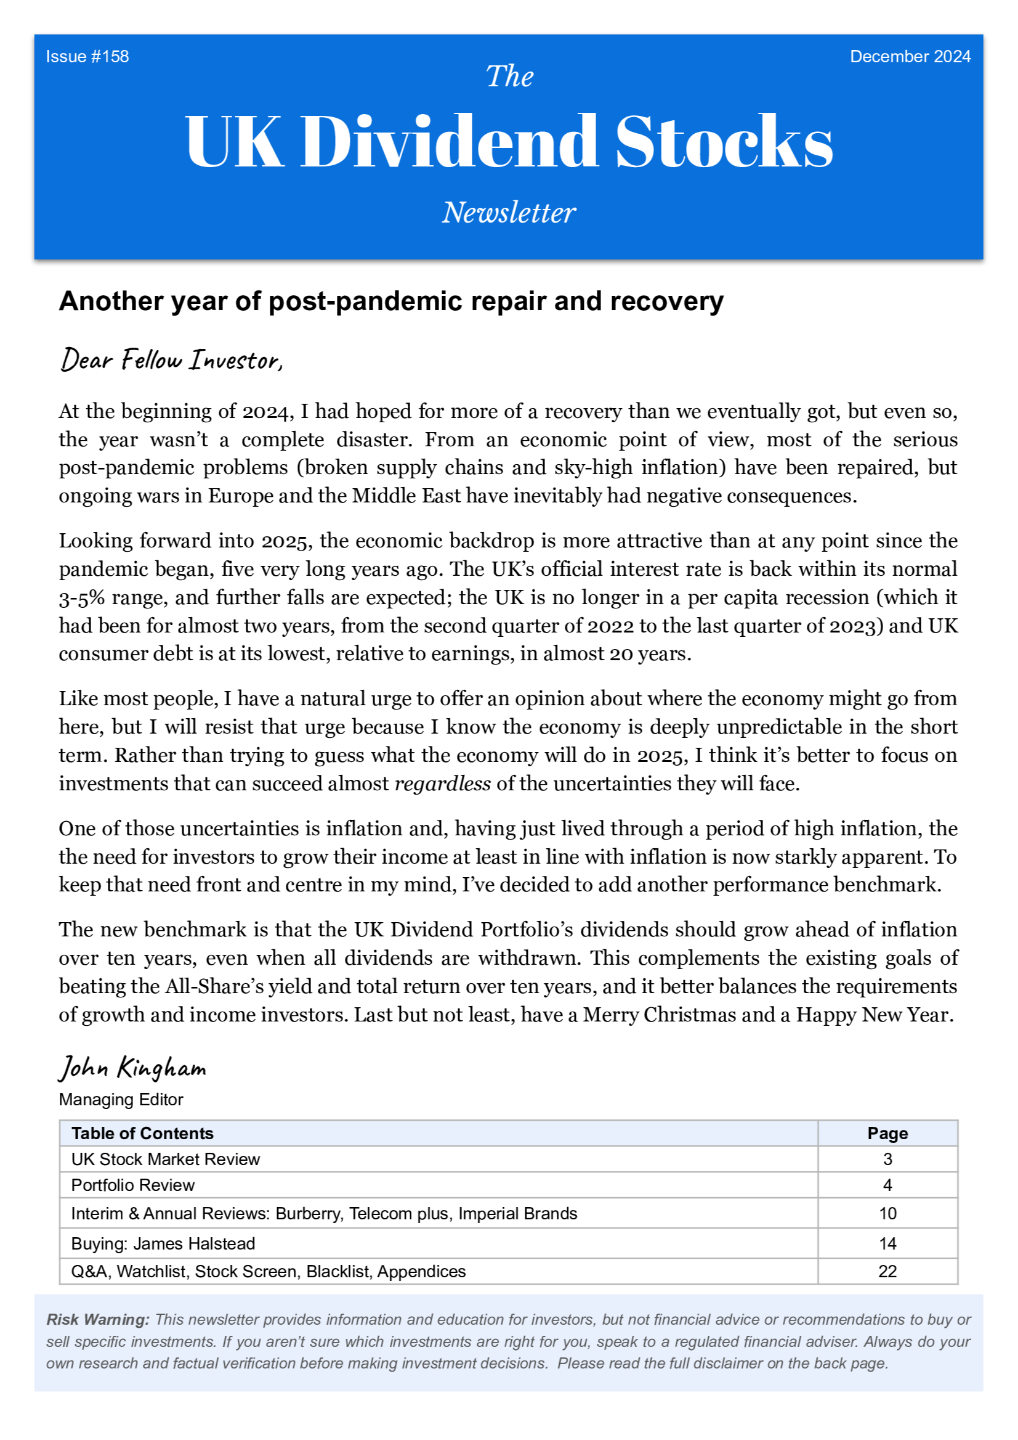
No time for spreadsheets or annual reports?
If you like this article but don’t have hours each month to dig through company accounts, you might find my monthly investment newsletter useful.
Once a month I send out a plain‑English PDF showing:
- The full UK dividend stocks model portfolio
- Which shares I’m buying, selling, trimming or topping up
- The latest news and trading updates for each holding
- Where we are in the stock market valuation cycle
All designed so a UK investor can stay on top of their dividend portfolio in well under an hour a month.
Get the latest blog posts & a free checklist
Get my latest articles in (at most) one email per week and download my dividend investing checklist. Topics usually include:
- Detailed reviews of high-quality UK dividend stocks
- Updates on my UK dividend stocks portfolio
- FTSE 100 and FTSE 250 valuations
- "How to" articles covering all aspects of dividend investing
No spam. Unsubscribe anytime.