
On June 16th the S&P 500 closed at just under 3,700, almost 24% below its record high of almost 4,800 in January.
Meanwhile, the NASDAQ index has fallen more than 30% from its late 2021 peak and many tech stocks like PayPal, Zoom and Peloton have fallen more than 70%.
Clearly, the US is in bear market territory, but is it close to the bottom or has this bear market only just begun?
Of course, the future is uncertain so nobody can know for sure, but we can use history to give us some idea of what might happen next.
Table of Contents
- History doesn't repeat itself, but it does rhyme
- CAPE is a simple and powerful measuring stick
- The recent bull market took the S&P 500's CAPE ratio back to dot-com levels
- CAPE says the S&P 500's fair value is lower than most investors think
- What are the prospects for returns over the next few years?
- Pinning the tail on the CAPE donkey
History doesn't repeat itself, but it does rhyme
To get the ball rolling, here's a chart showing how far the S&P 500 fell "underwater" in previous bear markets and how long it took to return to new highs (the data for most of the charts in this post come from Robert Shiller's excellent S&P 500 data resource).

If you're not familiar with this sort of chart, all you need to know is that zero on the left axis means the S&P 500 was reaching new highs and minus 20% (or any other number) means the S&P 500 was down 20% (which is also the official definition of a bear market).
The left-hand side of the chart shows a succession of bear markets with declines ranging from 25% to almost 40%. Then there was a huge decline after 1930 (the beginning of the Great Depression) and it took until 1955 before the S&P 500 begins making new highs.
On the right-hand side, there are several short bear markets with declines of 20% or so, and three major bear markets with declines of more than 40% (the 1970s oil crisis, the 2000-2003 dot-com crash and the 2008-2009 global financial crisis).
You can see the covid-crash of 2020 on the far right-hand side, just touching a 20% decline, and you can see the current bear market as a thin blue line on the extreme right-hand edge.
This chart tells us a lot about the history of bear markets. For example:
- Most bear markets involve declines of between 20% and 40%
- Some bear markets see declines of more than 40%, either because the economic background is exceptionally bad (such as in 1974 and 2009) or because the previous bull market left the S&P 500 exceptionally overvalued (as it was after the dot-com bubble)
- Very occasionally there can be depressions or major wars, where the market can fall a lot more than 40%
With a 24% decline so far, the current bear market is in line with most bear markets and, on that basis, it would be reasonable to assume that we're somewhere near the bottom.
However, if the economic environment becomes extremely bad or if the last bull market left the S&P 500 extremely overvalued, we could end up seeing declines of 40% or more.
I'm not an economist, so I don't have particularly strong views on where the US economy is going over the next year or two. Yes, inflation is very high and interest rates are rising fast, neither of which is good news for an economy in the short-term, but I don't want to pretend that I have any idea what the US economy will look like in 2023 or 2024.
As for valuations, this is where I feel more comfortable expressing an opinion. I think we have a decent set of tools which can tell us a lot about the market's current valuation and where it might go in the future.
And when it comes to valuing markets, my go-to measuring stick is Robert Shiller's Cyclically Adjusted PE (CAPE) ratio.
CAPE is a simple and powerful measuring stick
Most people value companies and indices with the standard PE or price-to-earnings ratio. The general idea is to compare the current PE ratio to its long-term average to see if the price is abnormally high or low relative to earnings, in the context of historical norms. In other words, the long-term average PE is often seen as an indicator of fair value.
To some extent, this makes sense because the value of a company should obviously be related to how much profit or earnings the company generates, but the standard PE ratio is a terrible measuring stick.
That's partly because earnings can be extremely volatile from one year to the next, so it's hard to say if a PE ratio of 20 is better than a PE of 10, because earnings might have doubled or halved because of unusual events (such as a pandemic) in a single year.
But it's mostly because a company's value doesn't depend on what it earned last year. Instead, a company's value comes from its ability to generate earnings and dividends over the long term, which is sometimes called its earnings power.
CAPE replaces one-year earnings in the standard PE ratio with an estimate of earnings power based on the average earnings over the last ten years, adjusted for inflation.
This gives CAPE a very stable earnings figure to compare prices against, and that makes it a significantly more stable and therefore better valuation tool than the standard PE ratio.
To give you an idea of just how much more stable these cyclically adjusted earnings are, here's a chart showing the S&P 500's one-year earnings versus its cyclically adjusted earnings over the last 50 years.

As you can see, annual earnings vary greatly over the short term and this is a normal part of the economic cycle. However, cyclically adjusted earnings are far more stable and this better reflects the underlying earnings power of the S&P 500.
With the CAPE ratio firmly in our grip, we can now return to the question of whether or not the recent bull market left the S&P 500 severely overvalued.
The recent bull market took the S&P 500's CAPE ratio back to dot-com levels
Here's a chart showing the S&P 500's CAPE ratio alongside the long-term (100-year) average CAPE ratio, covering the period from 1921 to the peak of the last bull market.

As with the standard PE ratio, the long-term average CAPE ratio is our benchmark for fair value because it filters out the short-term economic and emotional ups and downs of the market. If CAPE is far above average, the market is expensive, and if it's far below average, the market is cheap.
For example, in 1929 the S&P 500's CAPE was 33 compared to a long-term average at the time of 15. In other words, the S&P 500's price was more than double its estimated fair value. That almost never happens and it was a clear sign that the market was extremely overvalued. Perhaps unsurprisingly, the US market then crashed, taking CAPE far below fair value for most of the next 20 years.
Using the same logic, we can also say that the S&P 500 was somewhat overvalued through most of the 1960s (the go-go era) and extremely overvalued through the late 1990s dot-com bubble and the 2000s credit bubble.
We can also see that the latest bull market, shown on the far right-hand side of the chart, has taken the S&P 500 back to valuations higher than those of the roaring 1920s and second only to the dot-com bubble.
To be precise, at the peak of the last bull market the S&P 500 reached 4,800 and that gave it a CAPE ratio of 40, more than double its 100-year average of 18. This is potentially very bad news because the CAPE ratio never stays at extremely high levels for long:
- After the 1920s boom, the market crashed
- After the 1960s boom, the market crashed
- After the 1990s boom, the market crashed
And today, we're beginning to see history repeat itself, with the S&P 500 down as much as 24% in recent months.
But has that 24% decline been enough to bring the market back to fair value?
To put it bluntly, the answer is no.
CAPE says the S&P 500's fair value is lower than most investors think
Here's a zoomed-in version of the previous chart, showing CAPE and its long-term average over the last 30 years. This time it includes the 2022 bear market.

After the recent 24% decline, the S&P 500's CAPE ratio has reduced to 28, but that's still more than 50% above its fair value level of 18.
In fact, according to CAPE, if the S&P 500 was at fair value today it would be sitting just below 2,400.
Here's what that looks like on a chart of the S&P 500's price versus its CAPE-based fair value estimate.

The chart shows that fair value has been increasing steadily over the years, driven by inflation and economic growth in the US and across the world.
But the S&P 500's price has increased far ahead of fair value. The recent 24% decline has corrected that overvaluation to some extent, but the index is still very overvalued.
To put that into context, the current value of CAPE (28) is in the 89th percentile, which means it's higher than it was during 89% of the last 100 years. It was only higher 11% of the time, and most of those times came during the last 30 years when interest rates were low and speculation and optimism were high.
How will the S&P fare in a world of higher inflation, normalised interest rates and less optimism?
Let's find out.
What are the prospects for returns over the next few years?
Although we can't be precise in our prognostications, we can make some broad statements about what could happen.
For example, given that a CAPE ratio of 28 is in the 89th percentile, it's reasonable to say that there's about an 89% chance CAPE will be lower in the future than it is today, and about an 11% chance it will be higher.
On that basis, the odds are clearly stacked against the idea that we've already hit the bottom of this particular bear market.
It's also true that the S&P 500 spends almost all of its time in a range between half its fair value and twice its fair value. I have no idea why this is true, but it has been true for more than 130 years of the US market's history.
The next chart shows what that range of values looks like, going back to 1985 (shortly before the first Wall Street movie was released).

The rainbow shows you where the S&P 500 (in black) would have been at different valuations, going from half fair value (in green) to fair value (in yellow) and all the way up to twice fair value (in red).
You can see where the dot-com bubble briefly pushed the S&P 500 above this range in 1999 and 2000. But that level of manic optimism takes a lot of effort to sustain, so the market crashed and eventually fell a considerable way below fair value almost ten years later.
The long bull market of the 2010s and the covid-bubble have pushed the S&P 500 back above this range of sane valuations, although as with the dot-com bubble, it didn't stay there for long (it really is hard to stay irrationally exuberant for long).
At the far right of the rainbow, you can see that the recent bear market has brought the S&P 500 back from the brink of insanity, but it's still deep in the orange zone, which means it's still expensive relative to historical norms.
Given that the S&P 500 has stayed within this range for about 99% of the last 100 years, it's reasonable to assume that it will mostly stay within this range in the future.
Currently, that range extends from 4,800 at the top end to 1,200 at the bottom, so it would be reasonable to expect the S&P 500 to stay in that range for the next few years, although most investors will not find that statement very helpful.
Perhaps a more useful way to think about the future is to come up with some plausible scenarios. For example:
- Sideways scenario: If the S&P 500's fair value continues to grow at the historically average rate of 5%, fair value will reach 3,700 (the index's current value) in 2031. In other words, if the S&P 500 continues to grow its underlying earnings at a historically normal rate, there's a good chance its price could stay broadly flat from now until 2031.
- 1970s scenario: If central banks fail to get a grip on inflation, we could end up with a 1970s-style ramp-up of inflation and interest rates to double-digit levels. That could cause a major recession or even a series of recessions and that could push CAPE far below fair value, as it was through much of the 1970s and early 1980s. If CAPE fell to 12 two or three years from now, which is the level it reached in 2009, the S&P 500 would fall to 1,700. That's 54% below the current price.
Of course, I'm not saying either of these scenarios is going to happen. For all I know, the S&P 500 might turn around and go all the way up to 10,000 (although that seems unlikely).
But those scenarios are plausible and personally, I wouldn't be surprised if reality turned out to be similar to either one.
However, the S&P 500 will eventually return to new highs, although it might take a while. For example, in inflation-adjusted terms:
- After the 1906 peak, the S&P 500 was underwater for 22 years
- After the 1929 peak, the S&P 500 was underwater for 30 years
- After the 1969 peak, the S&P 500 was underwater for 23 years
- After the 2000 peak, the S&P 500 was underwater for 16 years
So don't be surprised if the S&P 500 takes ten or twenty years to exceed its 2021 high, once inflation is taken into account.
Pinning the tail on the CAPE donkey
Update: 3rd July 2022
After publishing this blog post and speaking to several readers, I think I may have focused too much on the idea of "fair value". While fair value is a central concept in investing, I think focusing on the S&P 500's CAPE-based fair value estimate comes across as being overly precise or predictive, especially if I say something like "fair value is 2,400".
The unfortunate reality is that CAPE's predictive power is weak, even though it's far stronger than most other valuation metrics.
A better approach might be to emphasise the odds that CAPE will be at a certain level in the future, based on what we know about the past.
For example, take a look at this chart.

This chart shows how many months the S&P 500's CAPE spent in various ranges since 1900. The chart shows that CAPE was between 5 and 10 for about 220 months (out of a total of 1,472 months). It also shows that CAPE was between 10 and 15 for more than 400 months.
In December 2021, the S&P 500 peaked with CAPE fractionally under 40, which is a level that CAPE has only ever reached for a few fleeting moments in history before crashing back to the 10 to 30 range.
If you aren't used to thinking probabilistically, you might understand this cart better if we play a game of "pin the tail on the (CAPE) donkey". It works like this:
Imagine we took that chart and printed it onto a poster-sized sheet of paper. Then we blindfold you and you throw a dart at the poster. If you miss the blue bars then you keep trying until you hit one.
Given that you're blindfolded so the dart will land in an essentially random place on the chart, which blue bars do you think the dart is most likely to hit?
Is it likely to hit one of the tiny blue bars on the right of the chart, where CAPE is above 30?
Or, is it more likely to hit one of the much larger blue bars on the left, where CAPE is below 30?
Given that the 10-15 and 15-20 bars are the largest and make up about half of the total area of all the blue bars, it's reasonable to assume that if you played this game this 100 times, you would hit one of those two bars about half the time.
What does this have to do with CAPE?
We know that in five or ten years, CAPE will almost certainly have a value within the range of those blue bars, with the odds of being in a particular range being equal to the odds of you hitting the associated blue bar with your dart.
So, could CAPE increase again over the next five or ten years, taking the S&P 500 back to record highs? Yes, but just as your dart is unlikely to hit the blue bars above 30, so CAPE is also unlikely to be above 30 in 2025 or 2030.
Could CAPE fall to less than 20 in five or ten years, taking the S&P 500 down almost 30% from its current level? The chart says yes, just as it's more likely than not that your dart will hit one of the bars to the left of 20 on the horizontal axis, it's more likely than not that CAPE will be below 20 within a few years.
So while we can never say exactly where CAPE and therefore the S&P 500 will be at any given moment in the future, we can say something about the probability of it being within a given range in five or ten years.
And as I've already said, history suggests that the S&P 500's CAPE is more likely to fall than rise over the next few years, which means the US bear market could have a long way to go before we reach the bottom.
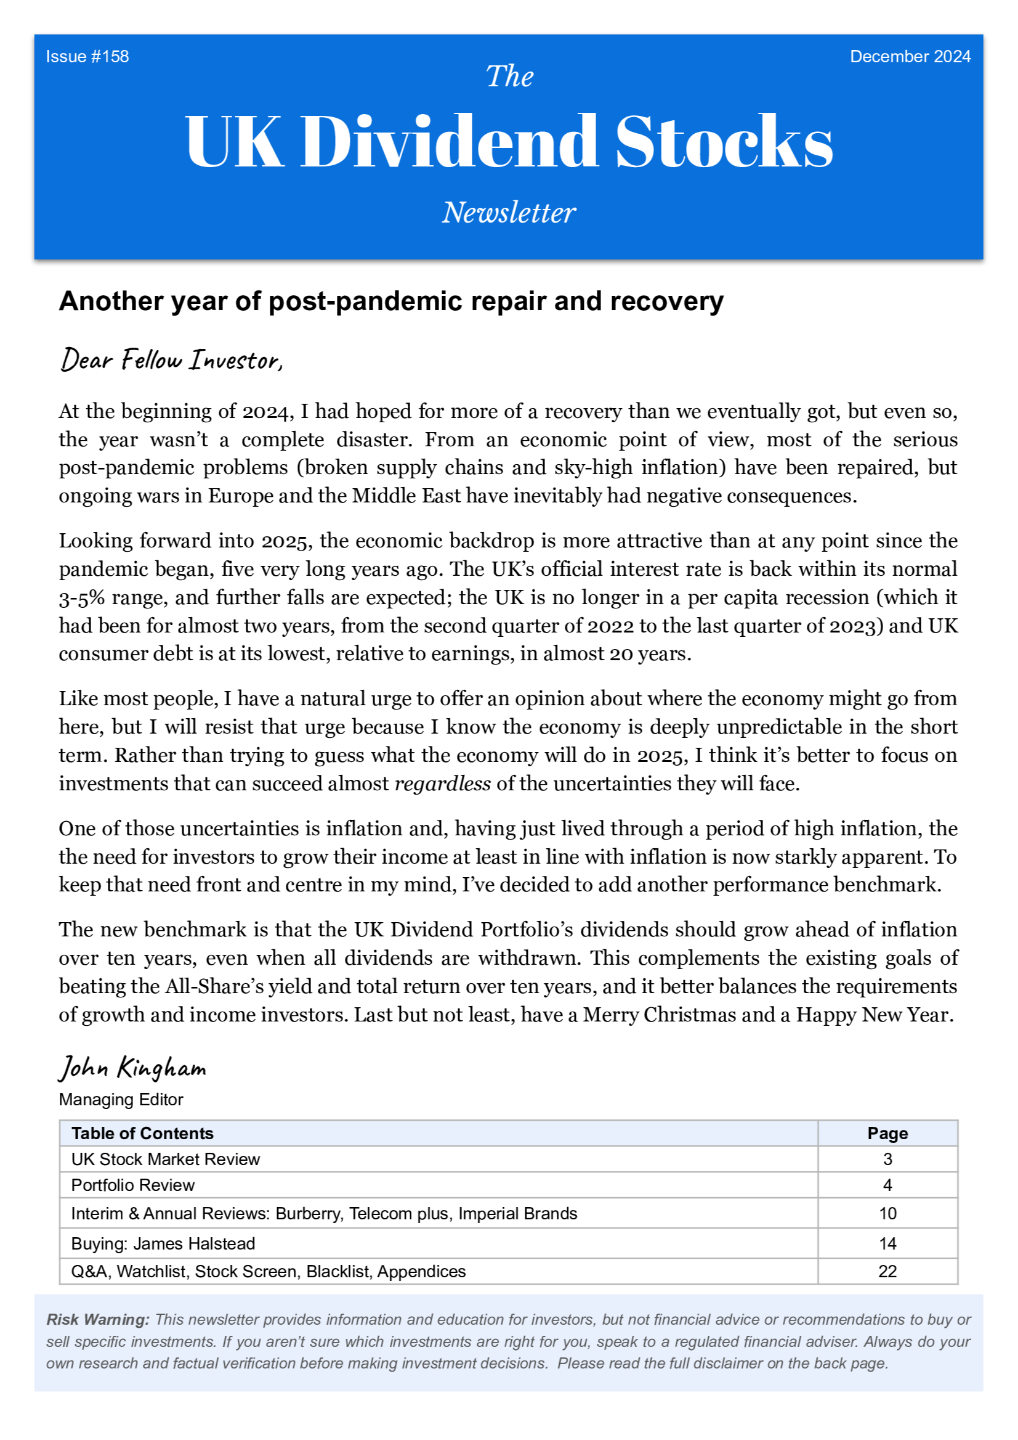
No time for spreadsheets or annual reports?
If you like this article but don’t have hours each month to dig through company accounts, you might find my monthly investment newsletter useful.
Once a month I send out a plain‑English PDF showing:
- The full UK dividend stocks model portfolio
- Which shares I’m buying, selling, trimming or topping up
- The latest news and trading updates for each holding
- Where we are in the stock market valuation cycle
All designed so a UK investor can stay on top of their dividend portfolio in well under an hour a month.
Get the latest blog posts & a free checklist
Get my latest articles in (at most) one email per week and download my dividend investing checklist. Topics usually include:
- Detailed reviews of high-quality UK dividend stocks
- Updates on my UK dividend stocks portfolio
- FTSE 100 and FTSE 250 valuations
- "How to" articles covering all aspects of dividend investing
No spam. Unsubscribe anytime.