It's November 2021 and the S&P 500 is up about 25% for the year so far, which is very nice.
It's also up about 600% since the 2009 crash, after a record-breaking 13-year bull market.
But trees don't grow to the sky and stocks don't go to the moon, so in this post, I'm going to look at how the S&P 500's incredible price increase has affected its CAPE ratio.
Table of Contents
- A brief review of the CAPE ratio
- The S&P 500's average CAPE has been very stable for over 100 years
- Emotion has driven the S&P 500's CAPE ratio to more than twice its long-term average
- When CAPE is high, expected future returns are low
- The S&P 500 might crash or stagnate, but either way, expected returns are low
A brief review of the CAPE ratio
The CAPE (cyclically adjusted PE) ratio is an improved version of the standard PE (price to earnings) ratio.
The standard PE ratio compares an investment's current price to last year's earnings. But last year's earnings could have been exceptionally high or low (or negative) so the standard PE ratio is often a very unreliable valuation tool.
CAPE fixed the standard PE ratio's shortcomings by comparing today's price to a ten-year average of inflation-adjusted earnings. This removes the potential problems of exceptionally high or low earnings and instead allows us to compare price to a reasonable estimate of "normal" earnings.
The S&P 500's average CAPE has been very stable for over 100 years
Thanks to the work of Professor Robert Shiller (author of Irrational Exuberance, which highlighted the lunacy of the dot-com bubble before it popped), we have data for the S&P 500 going back to the 19th century.
If we look at the average S&P 500 CAPE over the last 100 years we can see that the average CAPE has been very stable for many decades. For most of the last century, the average CAPE ratio was around 15, but in the last two decades, it's moved up to 18.
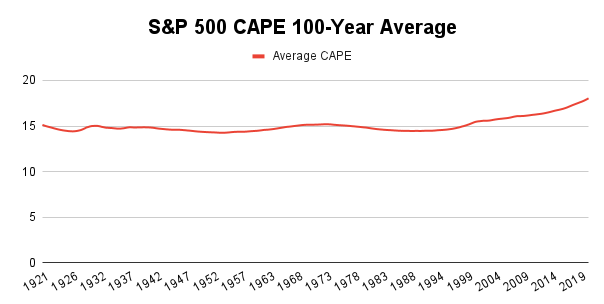
The stability of this average tells us that on average, and over the long-term, investors have typically been willing to pay about the same price-earnings multiple to invest in companies.
That makes sense because the return investors seek is deeply ingrained in human nature, and human nature doesn't change over a hundred or even a thousand years.
However, while human nature is effectively unchanging, it is also primarily emotional rather than rational and that emotion can cause CAPE to swing wildly in the short term.
Emotion has driven the S&P 500's CAPE ratio to more than twice its long-term average
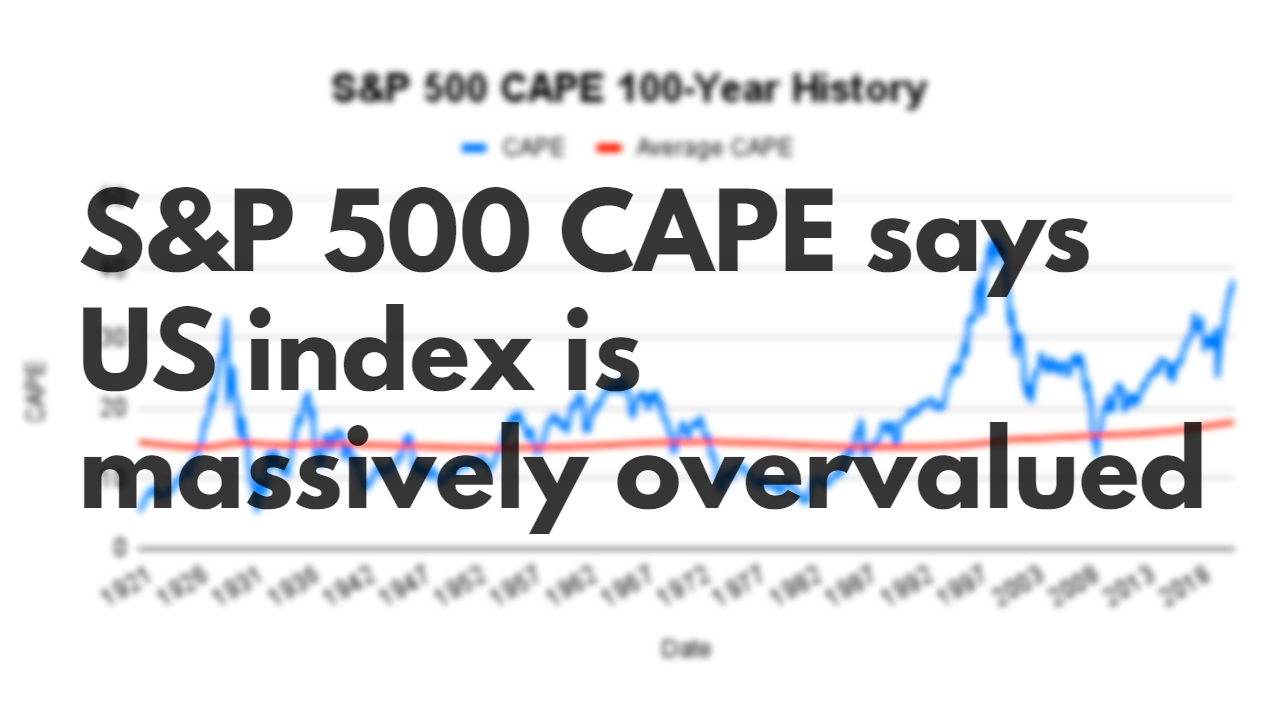
Here's a chart showing how emotion drives the CAPE ratio far above and far below its long-term average during periods of optimism (booms) and pessimism (busts).

As you can see, CAPE swings up and down with optimism and pessimism, going from times of high optimism in the late 1920s, the late 1960s and the late 1990s, to times of pessimism in the 1930s and 1940s, the 1970s and the early 2010s.
Today, the S&P 500 is at 4,700 and that gives it a CAPE ratio of 40. That's more than double the long-term average of 18, it's higher than the peak of the roaring 20s bubble and it's almost as high as the peak of the dot-com bubble. Of course, both of those bubbles subsequently popped, causing much misery and pain.
Of course, this time may be different, but history tells us that CAPE doesn't just go to the moon and stay there. It may go to the moon, but given enough time it has always come crashing back down to its long-term average.
Given the extremely high level of CAPE today, this has serious implications for the S&P 500's expected future returns.
When CAPE is high, expected future returns are low
Whenever CAPE has been materially above its long-term average, returns at some point over the next decade or two have always been bad.
There are two reasons why:
- Low yield: A high CAPE ratio is usually accompanied by a low dividend yield and that reduces total return
- Mean reversion: A high CAPE ratio eventually reverts back to its long-term average, and that usually happens because share prices collapse
In terms of dividend yield, the S&P has a dividend yield of around 1.3%, which is well below the long-term average of around 3-4%.
Yes, US stocks return lots of cash to shareholders through buybacks, but if those shares are bought back at extremely high valuations then investors would be better off with dividends instead.
As for price declines, it seems likely that at some point the S&P 500's CAPE ratio will once again reach its long-term average of 18. That means CAPE is likely to decline by 50% or more and there are various ways that could happen.
The S&P 500 might crash or stagnate, but either way, expected returns are low
I think there are three main scenarios: Crash, stagnation or massive growth.
Scenario 1: The S&P 500 crashes by 50% or more
The first scenario is that the S&P 500 crashes by 50% or so at some point in the next few years.
That will sound implausibly pessimistic to many US bulls today, and I'm sure it would have sounded implausibly pessimistic to most investors in 1929 or 1999 as well. And yet the market crashed on both occasions as CAPE reverted back towards its long-term average.
Of course, I'm not saying the US market will crash, but history does suggest it's the most likely outcome.
Scenario 2: The S&P 500 stagnates for a decade
Let's be somewhat optimistic and say that the S&P 500's earnings doubled over the next decade, leading to a 100% increase in its cyclically adjusted earnings. From a historical perspective that's about average.
If earnings double over the next decade and CAPE decreases by 50% back to its long-term average, the net outcome would be that the S&P 500 goes nowhere for the next ten years.
In other words, even if the S&P 500's earnings grow at their historically average rate, the S&P 500 could stay flat for a decade and by 2013 it would just about reach historically average valuation levels.
Scenario 3: Massive earnings growth allows CAPE to revert to historical norms while driving the S&P 500 higher at the same time
This is basically what most US investors are implicitly or explicitly expecting. For example, if the S&P 500's earnings quadruple over the next decade then CAPE could decline by 50% to normal levels, but because earnings have gone up fourfold the S&P 500's price would still double.
Under this scenario, investors can have their cake and eat it. They get back to a sensible valuation level by 2031 and they also get decent capital gains too.
Of course, for the S&P 500's cyclically adjusted earnings to quadruple over the next decade they would have to grow, sustainably over many years, at double their historical rate.
To put it bluntly, that sounds like an extremely unlikely scenario to me.
Despite all the excitement over tech stocks in recent years, there is no obvious sign (yet) of any material pick-up in the growth rate of the S&P 500's cyclically adjusted earnings.
For example, the rainbow in the chart below follows the growth of cyclically adjusted earnings since 1986, and while the rainbow's upward trajectory is impressive, it isn't bending upwards like a hockey stock which is what you'd see if growth was accelerating.
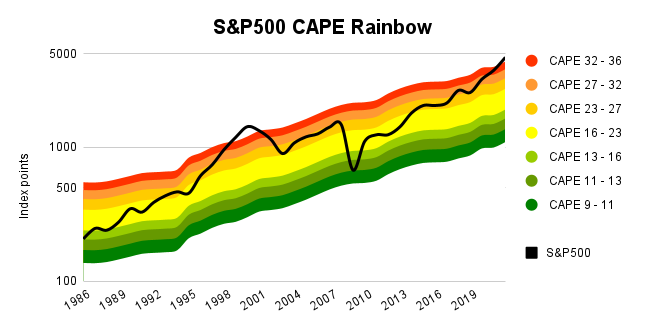
If you haven't seen this chart before, the red band is "bubble" valuations (twice the average), yellow is "fair value" (average) and green is depression/bargain territory (half the average).
The S&P 500 (the black line) is currently moving beyond the red zone, just like it did in 1999.
That is not a good sign and as far as I can tell, the likely outcome for the S&P 500 is a major crash at some point in the next few years, or possibly a decade or so of stagnation.
No time for spreadsheets or annual reports?
If you like this article but don’t have hours each month to dig through company accounts, you might find my monthly investment newsletter useful.
Once a month I send out a plain‑English PDF showing:
- The full UK dividend stocks model portfolio
- Which shares I’m buying, selling, trimming or topping up
- The latest news and trading updates for each holding
- Where we are in the stock market valuation cycle
All designed so a UK investor can stay on top of their dividend portfolio in well under an hour a month.
Get the latest blog posts & a free checklist
Get my latest articles in (at most) one email per week and download my dividend investing checklist. Topics usually include:
- Detailed reviews of high-quality UK dividend stocks
- Updates on my UK dividend stocks portfolio
- FTSE 100 and FTSE 250 valuations
- "How to" articles covering all aspects of dividend investing
No spam. Unsubscribe anytime.