
Like most stock market indices around the world, the S&P 500 did not have a particularly good 2022.
Shortly after reaching a new all-time high in 2021, the index went from 4,766 at the start of 2022 to 3,840 by the end, recording a capital loss for the year of 19.4%.
From its all-time high of 4,973, the S&P 500 has now fallen 23% (as of January 1st), so the US large-cap index is still in a bear market.
Unfortunately, the S&P 500's CAPE ratio reached bubble levels in late 2021, so despite these double-digit declines, the index still has a long way to go before valuations reach historically normal levels.
Table of contents
- All good things (and bull markets) must come to an end
- In 2021, the S&P 500 almost reached dot-com levels of insanity
- The bubble is over, but the S&P 500 is still expensive
- The S&P 500 forecast for 2023 isn't looking good
- Forecast returns for the next decade are also pretty bad
All good things (and bull markets) must come to an end

You don’t have to be Warren Buffett to know that the S&P 500 has just been through one of its longest bull markets, which started way back in 2009 (if you ignore the short-lived covid-crash of 2020).
From the beginning of the bull market to the end, the S&P 500 went up almost 600%, from less than 700 in 2009 to almost 5,000 in late 2021. This has, of course, made many investors very happy.
There are downsides to long bull markets though. One of the main downsides is that long bull markets gradually suck in more and more cash from less and less experienced investors. The least experienced investors usually get in right at the top, just before the whole thing comes crashing down.
And I’m not just using the word ‘crash’ for dramatic effect, because the simple truth is that long bull markets have almost always ended in severe bear markets.
For example, after a largely unbroken 20-year bull market from 1948 to 1968, the S&P 500 lost more than 60% in real terms over the next 14 years.
The index then enjoyed another almost unbroken 20-year bull market from 1982 to 2000, and that was also followed by a near-60% real-term loss over the next nine years.
So, the lesson from history is clear: Long bull markets are great while they last, but historically their legacy has been a decade or more of potentially devastating losses.
In 2021, the S&P 500 almost reached dot-com levels of insanity
Long bull markets are usually followed by vicious bear markets because the prolonged period of steady gains leads to a build-up of optimism that drives prices and valuations to levels that are completely unjustified by fundamentals like revenues, earnings and dividends.
Reality can be an unpleasant place, so eventually, something undermines that optimism and prices start to fall, just a little. Falling prices further undermine optimism and that makes prices fall a little more, and before you know it, optimism turns into panic and everybody starts running for the exit.
For a detailed look at how optimism and pessimism are key drivers of cycles in the economy and the stock market, you should read Howard Marks’ book, Mastering the Market Cycle. Alternatively, the image below captures the emotional rollercoaster that drives bull and bear markets.

Source: Plotting our position in the market cycle (Shares Magazine)
These emotional ups and downs can have a dramatic effect on valuations. My go-to tool for measuring this effect is the Cyclically Adjusted PE Ratio (CAPE), which is a much more stable and therefore reliable version of the standard price/earnings (PE) ratio.
To use CAPE, you just compare the current value to the long-term average. If CAPE is far above average then stocks are expensive because investors are optimistic, and if CAPE is far below average then stocks are cheap because investors are pessimistic.
There are, of course, limits to optimism and pessimism, and historically, investors have almost never been optimistic enough to drive CAPE higher than double its long-term average or pessimistic enough to drive CAPE below half its long-term average.
As investors swing between optimism and pessimism, CAPE swings back and forth, moving above and below its long-term average, and you can see this process in action in the chart below. It shows the S&P 500 over the last 100 years, superimposed over a rainbow that tells you whether CAPE was high, low or "just right" relative to its long-term average.

Here’s the key to the rainbow's colours:
- Red: CAPE is close to double its long-term average, so the S&P 500 is extremely overvalued and probably in a bubble
- Yellow: CAPE is close to its long-term average so the S&P 500 is close to fair value
- Green: CAPE is close to half its long-term average, so the S&P 500 is extremely cheap and the economy is probably close to a depression
As you can see from the chart, over the last 100 years, the S&P 500’s CAPE has almost never gone outside the range of half to double its long-term average.
There was a brief period in 1932 (the start of the Great Depression) when CAPE fell below that range, and this happened again in 1982 (at the end of the stagflationary 1970s). However, as all good contrarian investors know, returns in the years after 1932 and 1982 were nothing short of spectacular.
On the other hand, euphoria pushed the S&P 500’s CAPE to more than double its long-term average in 1929 (just before the Wall Street Crash) and in the late 1990s dot-com bubble CAPE reached almost three times its long-term average. As I've already said, the sad truth is that all bubbles eventually burst, and returns after the 1929 and 1999 bubbles were nothing short of terrible.
The bad news is that at the end of 2021, after 12 years of an almost unbroken bull market, CAPE had once again gone beyond twice its long-term average, reaching a high of 40 compared to a rolling 100-year average of 18.
From that level of optimism and overvaluation, history tells us that it will take more than the minor bear market of 2022 to return the S&P 500 to fair value.
The bubble is over, but the S&P 500 is still expensive

The chart above is a zoomed-in version of the previous 100-year chart, this time showing the S&P 500 and its CAPE-based valuation since 1985. This shows the dot-com bubble, its two subsequent bear markets and the more recent "everything bubble" more clearly.
So far, the S&P 500 has fallen a total of 23%, but if you factor in inflation then it has already fallen 27%.
Those are fairly significant declines, but they haven’t returned the index to fair value. Far from it. While the S&P 500's valuation is much more sensible today than it was a year ago, its CAPE ratio is still 28, which is well above the 100-year average of 18.
As you can see from the chart, the S&P 500 is no longer in a bubble, but its CAPE ratio is still in the "very expensive" zone and that has negative implications for the index’s expected future returns.
The S&P 500 forecast for 2023 isn't looking good
The future is always uncertain, but we can still make a guess as to what might happen, and that's all a forecast is. How accurate a forecast is will depend on what you're trying to forecast, and I think a one-year stock market forecast is probably about as accurate as a one-year weather forecast.
If I'm forecasting the weather in London one year from today, the obvious thing to do is consult the historical record and use historically average weather as my forecast, perhaps making minor adjustments to take account of longer-term trends like climate change.
Exactly the same ideas can be applied to the stock market.
In this case, the price of the market at the end of 2023 will depend on the S&P 500's cyclically adjusted earnings and its CAPE ratio.
Using historical averages and the Fed's target, we can forecast inflation to be 2% (which seems very unlikely, but it will do as a simple assumption). We can also forecast the S&P 500's cyclically adjusted earnings to grow at their historically average inflation-adjusted rate of 4.3% per year. In total then, the earnings component is forecast to grow by 6.3%.
As for CAPE, the 100-year average is 18.3, so that will be my forecast.
Putting those earnings and valuation forecasts together gives the following:
- 2023 S&P 500 Forecast: If the index is at fair value at the end of 2023 it will fall to 2,710
That's a pretty negative forecast. If the S&P 500 falls to 2,710 it will have fallen by 30% in 2023 and by 45% from its all-time high of 4,973. If we include inflation then the forecast decline from the recent all-time high is closer to 50%.
That may seem overly pessimistic, but history tells us that real declines of 50% or more are exactly what we should expect in the wake of a full-blown stock market bubble.
Some people hate the idea of forecasts that forecast specific values like 2,710. I can understand that, so here's another approach to forecasting the market, which only forecasts the odds of it going up or down.
It works like this: When the market is at fair value, there is an approximately 50/50 chance that it will go up or down over the next year, but if CAPE is very high then it's much more likely to go down and if CAPE is very low then it's much more likely to go up (this is mean reversion in action).
If we look back over the last century, history tells us that CAPE was below 40 (the value it reached at the end of 2021) 98% of the time. In other words:
- With a CAPE ratio of 40 at the peak of the bubble in late 2021, there was a 98% chance that the S&P 500 would decline in 2022
That decline did occur and CAPE has fallen to a slightly less optimistic 28. Looking forward, history tells us that:
- With a CAPE ratio of 28 at the end of 2022, there is a 90% chance that the S&P 500 will fall in 2023
This forecast is still very negative, but at least the remaining optimists have a 10% chance of being right.
Forecast returns for the next decade are also pretty bad
Long-term investors should be thinking about long-term returns, so I think a ten-year forecast is useful.
This is relatively easy to do if we just re-use the previous forecasts for inflation (2%) and real earnings growth (4.3%) to forecast a cyclically adjusted earnings growth rate of 6.3% over the next decade.
As for forecasting CAPE, 2032 is a long way in the future and the S&P 500 could easily be at the peak of another bubble or in the depths of another depression, or it might even be at fair value. Given the range of possible outcomes, I think it's useful to produce multiple forecasts:
- 2032 Bubble:
- If the S&P 500 is in a bubble in 2032 (CAPE = 36) it would be at 9,380
- That's a 144% capital gain over ten years
- Including dividends, that's an annualised total return of 11%
- 2032 Fair value:
- If the S&P 500 is at fair value in 2032 (CAPE = 18) it would be at 4,690
- That's a 22% capital gain over ten years
- Including dividends, that's an annualised total return of 4.2%
- 2032 Depression:
- If the S&P 500 is at depression levels in 2032 (CAPE = 9) it could be as low as 2,344
- That's a minus 39% capital loss over ten years
- Including dividends, that's an annualised total return of minus 1.7%
As you can see, the S&P 500 is only expected to produce good returns over the next decade if there is another bubble in 2032. Failing that, the S&P 500 is expected to produce weak longer-term returns because its valuation has yet to fully recover to normal levels following the last bubble.
The good news is that if the S&P 500 does go through a severe bear market in the shorter term (1-3 years), at least expected returns from that point will become attractive once again.
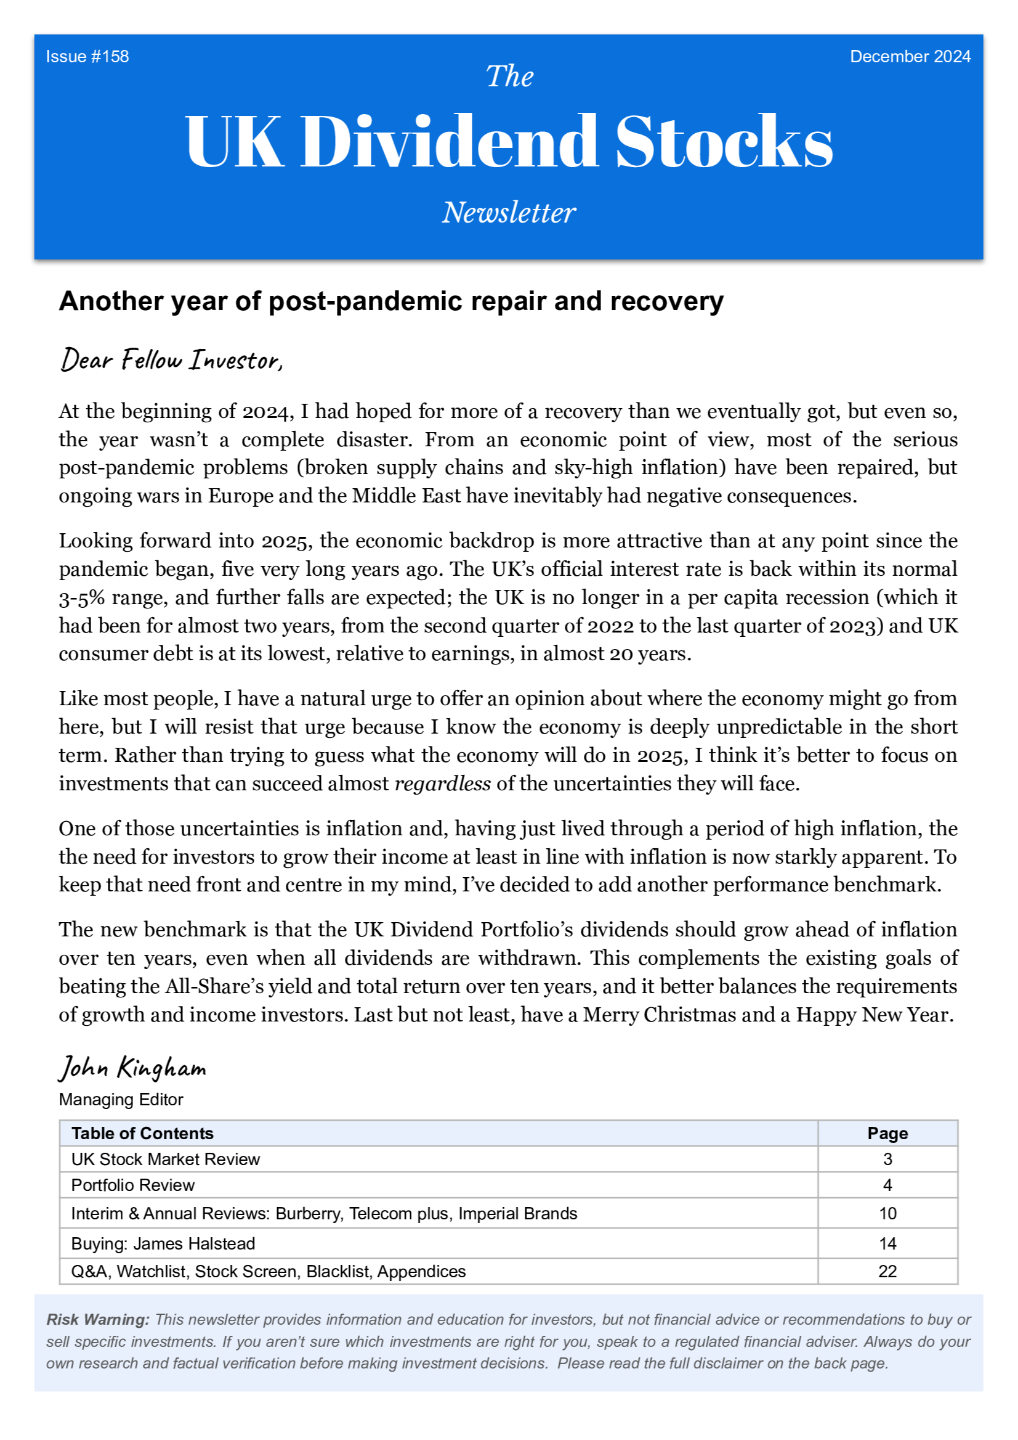
No time for spreadsheets or annual reports?
If you like this article but don’t have hours each month to dig through company accounts, you might find my monthly investment newsletter useful.
Once a month I send out a plain‑English PDF showing:
- The full UK dividend stocks model portfolio
- Which shares I’m buying, selling, trimming or topping up
- The latest news and trading updates for each holding
- Where we are in the stock market valuation cycle
All designed so a UK investor can stay on top of their dividend portfolio in well under an hour a month.
Get the latest blog posts & a free checklist
Get my latest articles in (at most) one email per week and download my dividend investing checklist. Topics usually include:
- Detailed reviews of high-quality UK dividend stocks
- Updates on my UK dividend stocks portfolio
- FTSE 100 and FTSE 250 valuations
- "How to" articles covering all aspects of dividend investing
No spam. Unsubscribe anytime.