
I think you would be hard pressed to find anyone who thought UK house prices were cheap.
Instead, most people are well-aware that UK house prices are extremely high and that this is a serious problem for millions of people in their 20s and 30s.
Despite house prices being so obviously high, most people also seem to think that house prices only go up. Or, if they do admit to the possibility of a property downturn, they think it will be limited to a short-lived decline of perhaps 5% to 10%.
The historical record, on the other hand, tells a very different story. It tells us there is a very realistic chance that UK house prices, relative to wages, could fall at least 30% and perhaps as much as 50%.
Table of contents
- UK house prices are very obviously very high
- Most prospective first-time buyers can’t even afford a measly 5% deposit
- Most prospective first-time buyers can’t get a big enough mortgage
- The UK housing market is in a bubble
- The UK housing PE ratio is at an all-time high
- Bubbles are called bubbles because they pop
- House prices could fall at least 30% and as much as 50%
UK house prices are very obviously very high

I’ll begin with the obvious. UK house prices are extraordinarily expensive and they have been for years. This shows up in many different ways. For example:
Most prospective first-time buyers can’t even afford a measly 5% deposit
If a 30-year-old wants to buy a house, they’ll need a 5% deposit at the very least.
The average UK house price (according to the Nationwide House Price Index) reached £273,000 in 2022, so even a measly 5% deposit will set you back almost £14,000, and few 30-year-olds have that much cash sitting around.
But the situation is even worse than that, because the cost of buying a house includes valuation fees, surveyor fees, legal fees, mortgage fees and moving fees. It could easily cost the thick end of £20,000 to buy your first house, and then of course you have to furnish the thing.
No wonder home ownership among 25-34-year-olds has almost halved over the last 30 years, and that the proportion of joint first-time buyers has increased to 63%, outnumbering individual first-time buyers who used to make up the majority.
This is clear evidence that house prices are simply unaffordable for most people under 30 unless they pair up with someone and buy as a couple.
The other option is to borrow from The Bank of Mum and Dad (BOMAD), if you're lucky enough to have access to such a thing. BOMAD lends about £5 billion per year to its children, funding about £80 billion of property purchases that otherwise wouldn’t happen.
The growth of BOMAD lending is a key reason why the average deposit (according to the Halifax First-Time Buyer Review) is now an astonishing £62,000. That's more than the average house cost as recently as 1997.
Most prospective first-time buyers can’t get a big enough mortgage
If a first-time buyer manages to scrape together a 5% deposit, they'll need a 95% mortgage. If they want to buy an average house with its average price of £273,000, they'll need a mortgage of about £260,000.
If our average 30-year-old is lucky enough to earn the average UK wage of £32,000, that means they need a mortgage that is eight-times their income. That’s a big problem because most banks will only lend up to five-times the borrower's salary. If you want to borrow more than that, you'll need a salary far above average or you'll need a much bigger deposit (most likely via BOMAD).
If our fictional first-time buyer is half of a couple, there is a chance that they could buy a house using Nationwide’s Helping Hand scheme. If they earn a combined £55,000 or more (which two average 30-year-olds would), Nationwide might lend them 5.5-times their combined income, or £302,500, with just a 5% deposit.
So that's one specialised product from one lender in the market who might be able to lend the average 30-year-old couple enough to buy an average house.
To me, that is another clear sign that the UK housing market is massively overvalued. In fact, I don't just think house prices are overvalued, I think they're in yet another bubble.
The UK housing market is in a bubble
It’s one thing to say that house prices are high, but it’s another thing entirely to say they’re in a bubble. The bubble word implies that prices are unsustainable and that the bubble is going to burst (or at least deflate) at some point, and that is exactly what I’m saying.
The bubble argument is based on the house price to earnings (PE) ratio.
The UK housing PE ratio is at an all-time high
There is, obviously, a strong link between average UK house prices and the earnings of the average UK worker. More specifically, there is a strong link between average house prices and the average mortgage plus the average deposit.
Today, and historically, banks generally limit mortgages to four or five-times the borrower’s salary. If we assume that the average deposit is about equal to the average salary (currently it’s more than that but historically it was less) then we end up with an expected house price to earnings ratio of five or six, and that’s exactly what we’ve had in the UK for most of the last 70 years.

Over the last 70 years, the ratio of average house price to average earnings has varied between 3.9 and 8.6, but most of the time it has stayed fairly close to its long-term average of five or six.
And while the housing PE does occasionally move far above or below its long-term average, the ratio has always mean reverted back to that long-term average, eventually.
Bubbles are called bubbles because they pop
Here’s another version of that housing PE ratio chart, this time describing what the different valuation levels mean.

As you can see from the chart, house prices spent most of the last 70 years close to "fair value", where prices are not too high and not too low. Occasionally though, something happens to push prices above their normal range, but these periods rarely last more than a few years.
The 1970s Barber Boom: The first unsustainable spike in UK house prices occurred during the early 1970s Barber Boom, but this was short-lived. The boom quickly turned to bust and house prices were back at historically normal levels in short order.
The 1980s Property Boom: The second unsustainable spike in house prices came when the depressing stagflation of the 1970s finally ended. The 1970s gave way to a more optimistic 1980s, where Gordon Gekko's creed of "Greed is Good" worked its way into government policy and UK culture.
With optimism in the air, hundreds of thousands of people thought the good times would last forever, so they loaded themselves up to the eyeballs with mortgage debt and paid whatever was required to get on the property ladder.
This bubble was localised around London, so the national housing PE ratio only reached 6.9. That's slightly below what I would consider a full-blown national housing bubble, but across the UK, houses were still generally expensive and in and around London there was definitely a bubble.
Unfortunately for many of those first-time buyers, this bubble burst when interest rates went through the roof and unemployment followed shortly after.
This came as a surprise to many, but if you compare the 1989 housing PE of 6.9 to its long-term average (at the time) of 5.2, it was obvious that house prices were far too high.
Prices were also completely unsustainable and, over the six years from 1989 to 1995, the average house price fell 44% relative to the average wage.
The 2000s Mortgage Bubble: After the housing crash of the early 1990s, sentiment gradually improved and by 2000, house prices were back to their usual multiple of about five-times earnings.
The trigger for the next UK property bubble came in 2003, when interest rates were slashed to an unheard of 3.5% (interest rates had been above 5% for almost the entire time since the mid-1950s).
I can remember working in an office when the interest rate cut was announced, and people were literally jumping for joy. Others in the office were trying to get onto the TV program Location, Location, Location in order to grill its host, Phil Spencer, about becoming Buy to Let landlords.
Super-low interest rates were the initial spark, but what really inflated the bubble was reckless and excessive lending by banks.
At the peak of the credit bubble in 2007, the average UK house cost £184,000, or 8.5-times the then-average wage of £21,600.
After the global financial crisis, banks were less keen to lend 125% mortgages to anyone with a pulse, and without the rocket fuel of excessively large loans, the house price bubble collapsed.
Over the five years from 2007 to 2012, the average inflation-adjusted house price fell by 25%.
In an alternate reality, I think it’s very likely that house prices would have continued falling through much of the 2010s, perhaps ending with them back at historically average multiples of earnings.
But that didn’t happen. Instead, the government manipulated the market for its own short-term political gain, and that ignited the second UK housing bubble of the 21st century.
The 2010s Help to Buy Bubble: I don’t think I will be branded as a conspiracy theorist if I say that the current UK house price bubble was inflated by the government. I think most market analysts (professional or not) are well aware of that fact.
It began in 2013, when the government launched its shockingly moronic Help to Buy scheme, which enabled hundreds of thousands of people to buy houses they couldn’t afford. As more money was pumped into the housing market, and as there was no increase in supply, the inevitable result was an increase in prices.
In 2016, Help to Buy was joined by the Help to Buy ISA, which morphed into the Lifetime ISA. These are nothing more than additional ways for the government to "help" first-time buyers (to win over younger voters) while also achieving the goal of pushing up house prices (to keep older voters happy).
These policies, along with a decade of excessively low interest rates and the unnecessary suspension of stamp duty during the pandemic, have successfully pumped the average UK house price up to an incredible £273,000.
That leaves the house price to earnings ratio at 8.6, which is its highest level in more than 70 years.
History tells us that all bubbles eventually burst, so the UK housing market is in an extremely vulnerable position.
House prices could fall at least 30% and as much as 50%
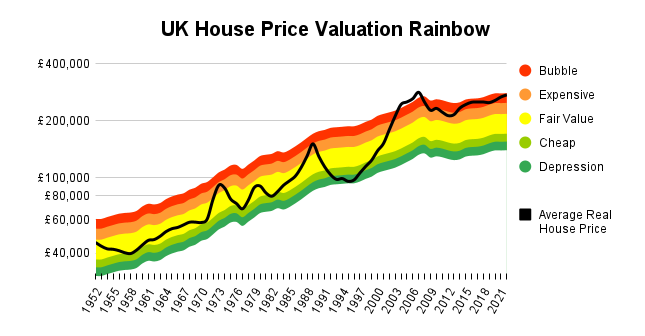
The chart above shows UK house prices, adjusted for inflation, alongside its PE-based valuation bands.
It clearly shows how house prices, for most of the last 20 years, have been abnormally high, thanks to reckless lending in the 2000s followed by excessively low interest rates from the Bank of England and government manipulation in the 2010s.
UK house prices are now at their highest level in more than 70 years, relative to earnings, so they are extremely vulnerable to some combination of (a) higher interest rates, (b) a deep or prolonged recession and (c) negative sentiment towards house prices.
If we do see interest rates in the (historically normal) 4-6% region for several years, and/or a long economic downturn, and/or increasingly negative sentiment towards house prices, my baseline assumption is that average prices will revert back to their historically average range of five to six-times average earnings.
Today, the average UK wage is about £32,000 and the 70-year average ratio of house prices to wages is 5.8. That gives us a “fair value” for the average house of £186,000.
In other words:
- If house prices reach fair value in 2023 (housing PE of 5.8) the average house price will have fallen 32% to £186,000
However, even I, a long-time property bear, don’t think that’s very likely. Instead, a far more likely outcome is that house prices fall to average valuations over a number of years.
If we look back to the 1990s crash, it took two years for house prices to go from extremely expensive back to fair value. Of course, they then spent the next four years falling to extremely low levels, but extremely low prices are as unlikely as extremely high prices, so I don’t expect this bubble to end in another 1990s-style housing depression.
If we look at the 2000s bubble, which peaked in 2007, it took five years to get prices back to just being expensive, and it could easily have taken another five years for them to get back to fair value (if the government hadn’t manipulated the market).
So, a more realistic forecast is to assume that house prices will fall to fair value over a five- or ten-year period.
Inflation can make a big difference over that sort of timeframe, so let's assume inflation stays at 2% per year. That is probably optimistic, but in lieu of a crystal ball, I think it’s a reasonable guess.
Also, the average UK wage, adjusted for inflation, has actually decreased since the global financial crisis. I think that’s an anomaly caused by the financial crisis and the pandemic, so I’m going to assume that average earnings grow 1% ahead of inflation, or 3% per year in nominal terms.
Over five years, that would take average earnings from £32,000 today to £37,000 in 2028, so based on those assumptions:
- If house prices reach fair value in 2028 (housing PE of 5.8), the average house price will have fallen 21% to £216,000
I think a 21% decline over five years is entirely possible, given that's similar to what happened when the 2000s bubble popped.
However, if house prices take ten years to revert to historically average levels, then of course inflation will cushion more of the nominal price decline. Using the previous assumptions, over ten years the average wage would increase to £43,000, so:
- If house prices reach fair value in 2032 (housing PE of 5.8) the average house price will have fallen 8% to £250,000
Although this seems like a more positive scenario, with a mere 8% nominal decline in total, it would mean that UK house prices gradually declined, year after year, for an entire decade.
That sort of prolonged decline could easily be enough to put huge numbers of young people off buying a home, because nobody wants to catch a falling knife. This is exactly what happened in the 1990s crash.
Given that a prolonged decline and deep pessimism is a distinct possibility, let's wrap up this housing market review with a really bearish outlook. Let’s say that UK house prices revert to fair value in 2028 but then continue to decline, thanks to the resulting pessimism, to the sort of depressed multiples not seen since the 1990s crash.
If that happens, the UK housing PE ratio would fall to 4.0 in 2032. With the average wage at £43,000, we get the following bearish scenario:
- If house prices are depressed in 2032 (housing PE of 4.0) the average house price will have fallen 37% to £172,000
A 37% decline in nominal terms over ten years is extremely bearish, but far from impossible.
Relative to wages, that's a decline of 52%, so there is a possibility that houses in 2032 could be half as expensive as they are today, and that would be great news for the next generation.
Of course, most people would say that such a decline is simply impossible and that the UK government would step in to save the day, as it has done repeatedly over the last 20 years.
That may well be the case. But if the government does step in with yet more support for buyers, it will simply be kicking the can down the road, blowing an even bigger house price bubble that will still inevitably burst at some point, causing even greater damage to the UK economy.
If I had to choose an outcome, I would prefer to see house prices decline back to fair value over the next five years, through a balanced combination of nominal price declines and strong above-inflation wage growth. But whether that will happen or not is another matter.
No time for spreadsheets or annual reports?
If you like this article but don’t have hours each month to dig through company accounts, you might find my monthly investment newsletter useful.
Once a month I send out a plain‑English PDF showing:
- The full UK dividend stocks model portfolio
- Which shares I’m buying, selling, trimming or topping up
- The latest news and trading updates for each holding
- Where we are in the stock market valuation cycle
All designed so a UK investor can stay on top of their dividend portfolio in well under an hour a month.
Get the latest blog posts & a free checklist
Get my latest articles in (at most) one email per week and download my dividend investing checklist. Topics usually include:
- Detailed reviews of high-quality UK dividend stocks
- Updates on my UK dividend stocks portfolio
- FTSE 100 and FTSE 250 valuations
- "How to" articles covering all aspects of dividend investing
No spam. Unsubscribe anytime.