After spending many years as an unloved also-ran, the FTSE 100 is finally getting its moment in the spotlight.
While it hasn't produced any growth in 2022, it has managed to fall by less than just about every other major index on the planet.
So far this year, the FTSE 250 and S&P 500 have both fallen more than 20% (the generally accepted definition of a bear market) and the US tech-focused NASDAQ index has fallen more than 30%.
In contrast, the FTSE 100 has fallen just 6% year-to-date.
Despite this recent run of relative success, investors are still wary of the FTSE 100 because its performance since 1999 has been terrible.
Ever the contrarian, in the rest of this post I will argue that the FTSE 100's current price is somewhat attractive and that a bear market would only make it more attractive. I'll also come up with a fair value estimate for the index and a conservative scenario for expected returns over the next decade.
Contents
- The FTSE 100 has gone nowhere for 22 years
- The FTSE 100 went nowhere for 22 years because valuations in 1999 were crazy
- After 22 years of going nowhere the FTSE 100 is below fair value
- A bear market could reduce the FTSE 100 to attractive levels
- The FTSE 100 is likely to be significantly higher ten years from now
First, let's get the bad news out of the way.
The FTSE 100 has gone nowhere for 22 years
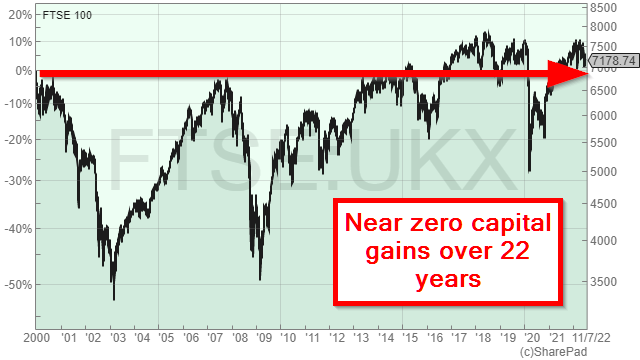
As I write, the FTSE 100's price is 7,200 and that's virtually unchanged from the 6,900 is first reached in 1999, more than 22 years ago.
Even worse, if the FTSE 100 followed much of the rest of the world into a bear market the index would fall (at the very least) to 6,100, which would be comfortably below where it was 22 years ago.
This terrible track record is one of the main reasons why almost nobody brags about investing in the FTSE 100. It's also one of the main reasons why so many young UK investors choose to invest in the S&P 500 or (if they can afford it) UK property.
But as we all know, past performance is no guarantee of future performance, and that applies to bad performance as well as good.
So instead of extrapolating the FTSE 100's poor track record into the future, we need to ask ourselves, what is going on here? Why has the FTSE 100 performed so badly?
If we do that, then the FTSE 100's future begins to look a little less bleak.
The FTSE 100 went nowhere for 22 years because valuations in 1999 were crazy
Everyone knows the story of the dot-com bubble, where the valuations of internet-related stocks went to the moon and then crashed back down to earth.
We can accurately capture that story by looking at the FTSE 100's CAPE ratio, or cyclically adjusted PE. CAPE is an improved version of the standard PE ratio because it compares the FTSE 100's price to its inflation-adjusted ten-year average earnings, and that smooths out the short-term earnings volatility that can make the standard PE ratio somewhat unreliable.
Fundamentally, CAPE works just like the standard PE ratio: when CAPE is above average the price is high and when CAPE is below average, the price is low.
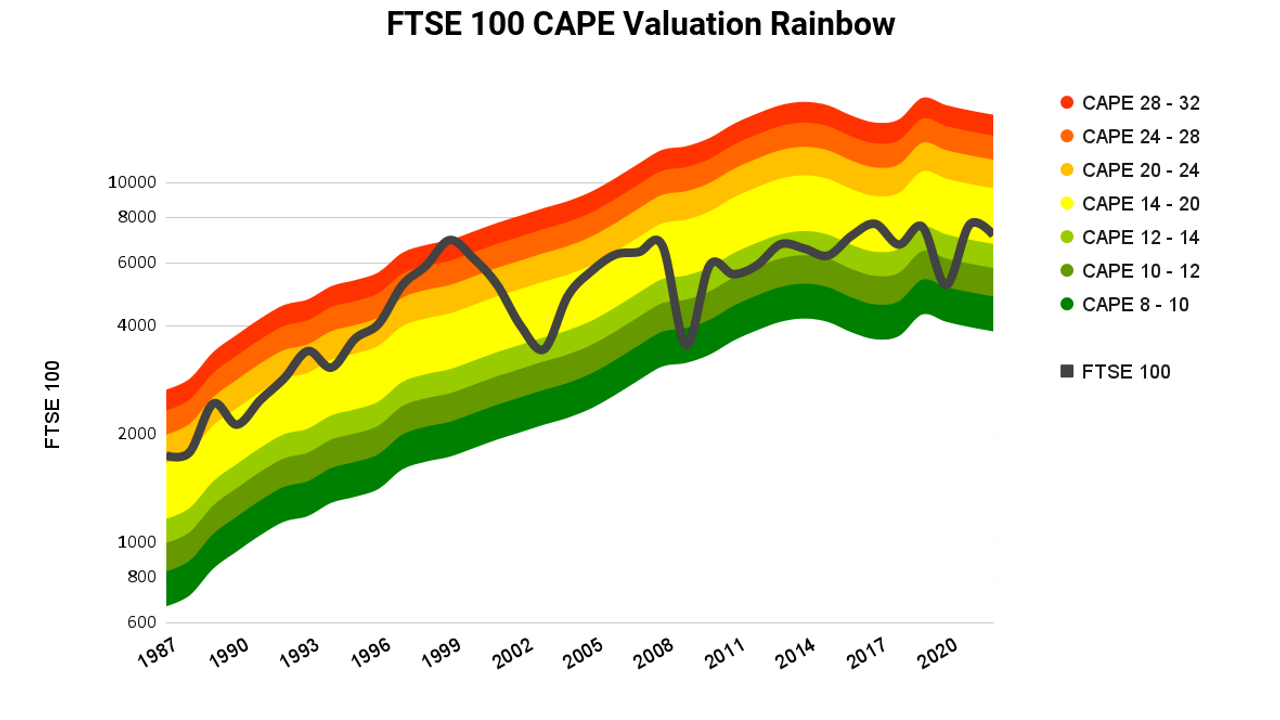
The following chart plots the FTSE 100's price (in black) superimposed over a CAPE rainbow, where red shows where the FTSE 100 would have been at high valuations, yellow shows where it would have been at average or "fair" values and green shows where the index would have been at low valuations.
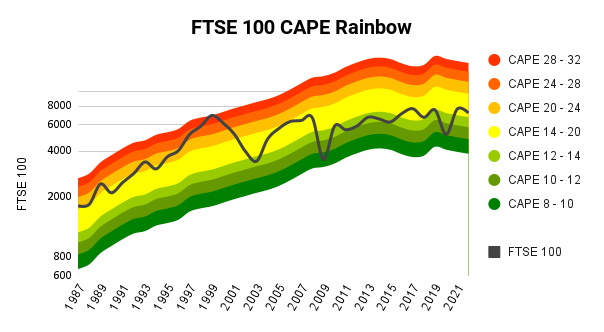
This chart tells us why the FTSE 100 has performed so badly over the last 22 years.
To begin with, if you look at where the FTSE 100 was is in 1999, you'll see it was right at the top of the valuation rainbow, with a CAPE ratio of 32.
The FTSE 100's CAPE has a long-term average of 16, so 32 is twice that average. History tells us that for most major indices, CAPE almost never grows to more than twice its long-term average and almost never falls below half its long-term average. That's why the CAPE rainbow extends from 8 (half of 16) to 32 (double 16).
History also tells us that there is almost no relationship between the value of CAPE today and the value of CAPE ten years later. So while CAPE was sky high in 1999, that didn't mean it would stay sky high forever.
And it gets worse, because the value of CAPE isn't random. It almost certainly won't be 8 ten years from now or 32. Instead, like the height or weight of people in the UK, CAPE has an approximately normal distribution, also known as a "bell curve" distribution.
Here's a chart showing the distribution of CAPE values (a histogram) for the S&P 500, with 100 years of data. I've chosen the S&P 500 because we have more data for it and more data is better.
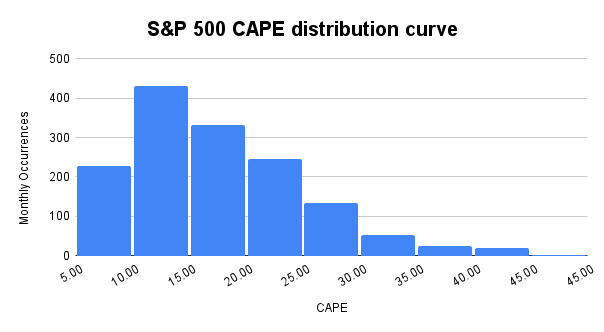 This chart tells us that over the last 100 years, the S&P 500's CAPE spent just over 200 months between 5 and 10, just over 400 months between 10 and 15, and so on.
The central peak of the chart tells us that, just as the height and weight of most people are reasonably close to average, CAPE spends most of its time reasonably close to the average (the S&P 500's average CAPE is about 18).
In fact, the S&P 500's CAPE spent almost 50% of the last 100 years between 10 and 20 and only 1.4% of the time above 40.
So now we know three things:
- The FTSE 100's average CAPE is 16
- CAPE spends most of its time reasonably close to average and very little time far away from average (and almost no time higher than twice the average or lower than half the average)
- Ten years in the future, CAPE will be determined primarily by its historical distribution (the blue chart above) and its value today will have almost no influence at all
If we apply those three facts to the FTSE 100 of 1999, the reason for the underperformance becomes obvious.
First, we know that CAPE was 32 in 1999. Second, we know that the long-term average CAPE was 16. Third, we know that ten years later, in 2009, CAPE was likely to be reasonably close to average, with perhaps a 50% chance of being between 10 and 20.
Given that declines in CAPE are almost always driven by price declines, investors in 1999 should have expected to see a 50% price decline at some point over the following decade, taking the index back down to 3,500 or so. And that's exactly what they got, on two separate occasions (2003 and 2009).
After 22 years of going nowhere the FTSE 100 is below fair value
The good news is that after 22 years of going nowhere in an interesting way, the FTSE 100 is now reasonably attractive.
While the index's price has gone nowhere, the amount of capital employed by the 100 companies that make up the index and the earnings and dividends they generate, have more than doubled.
So while the price remains frustratingly close to 7,000, the increase in earnings has reduced the FTSE 100's CAPE ratio to 15.
That's below the long-term average of 16, so the FTSE 100 is currently priced below fair value.
If you're not familiar with the idea of fair value, in this context it's just the price needed to make CAPE equal its long-term average of 16.
As of today, fair value is 7,700 compared to a current price of 7,200.
500 index points isn't a huge margin of safety, but it does give you a slightly above average dividend yield of 3.7% and it's a lot bigger than the margin of safety you'll get from the still massively overvalued S&P 500.
A bear market could reduce the FTSE 100 to attractive levels
As I said in the introduction, many other major indices are already in bear markets so I would say that the odds of a FTSE 100 bear market, especially if the UK enters a recession, are quite high.
This is making investors fearful, but in my opinion a bear market is only a bad thing if you have to sell your shares.
If you don't have to sell your shares and you're using dividends as income, then the robustness of your dividends is far more important than the ups and downs of share prices.
And if you're still building up your wealth, a bear market can be an excellent opportunity to buy more shares at lower valuations.
Let's be pessimistic and assume that the UK does enter a recession and that the FTSE 100 does fall into a bear market.
If the FTSE 100 falls 20% from where it started the year, it would fall to 6,100 (a level it first reached in 1998, before many of today's younger investors were even born).
With the FTSE 100 at 6,100, its dividend yield would be 4.3% compared to an average of 3.3%, its PE ratio would be 12.2 compared to an average of 16 and, more importantly, its CAPE ratio would be 12.7 compared to an average of 16.
Taken together, these are strong signs that at 6,100, the FTSE 100 would be trading at a meaningfully attractive valuation.
Here's an updated version of the previous CAPE rainbow chart showing the impact a fall to 6,100 would have on the FTSE 100's valuation.

With a CAPE ratio of 12.7, the FTSE 100 would fall into the green zone. It wouldn't be deep into the dark green zone as it was in 2009, but with a relatively low CAPE ratio and a relatively high dividend yield, total expected returns over the next decade would be comfortably above average.
To understand how much above average those returns might be, we can build a scenario of where the FTSE 100 is most likely to be in ten years.
The FTSE 100 is likely to be significantly higher ten years from now
Coming up with a central scenario for ten-year total returns is actually quite easy.
All you have to do is estimate the growth of earnings and dividends over the next ten years and estimate what CAPE will be at the end of that period.
Taking each in turn, my central scenario assumes that:
- Earnings and dividends grow at 5% per year to 2032
This assumption is based on the fact that over the past 35 years, the FTSE 100's cyclically adjusted earnings (the ten-year inflation-adjusted average) have grown by 5% per year on average.
Those 35 years cover periods of higher and lower inflation as well as booms and busts, so I'm comfortable sticking with 5% as my estimate for future earnings growth.
Also, the FTSE 100's dividends have grown by 4.5% over the last 35 years. Over the long-term I would expect earnings to grow in line with dividends, so I'm going to assume that dividends will also grow at 5% per year, which is only fractionally higher than the 35-year average.
- The FTSE 100's CAPE ratio is 16 in 2032
Since we have no idea what CAPE will be ten years from now, I'm going to assume that CAPE is equal to its long-term average. This will of course turn out to be wrong, but the long-term average is still the best guess because it's the closest value to all the other possible values.
Alternatively, if you wanted to hedge your bets, it would be reasonable to say that there's about a 50% chance CAPE will be between 10 and 20.
With those assumptions in place, we can use them to calculate some outcomes:
- The FTSE 100's price reaches 12,600 by 2032
This is simple arithmetic. If cyclically adjusted earnings grow at 5% per year to 2032 (from 483 index points to 787), then a CAPE ratio of 16 would leave the FTSE 100 at 12,600.
Alternatively, we can give a range of values that the FTSE 100 might reasonably have, based on the fact that CAPE spends about half its time between 10 and 20:
- There is a 50% chance the FTSE 100 will be between 7,900 and 15,700 in 2032
I think a scenario where the FTSE 100 reaches 12,600 by 2032 is both conservative and realistic. However, many investors will think my scenario is insanely optimistic.
That's because many people simply cannot imagine the FTSE 100 at 12,600 because they have become so used to seeing it at 7,000 (perhaps for their whole lives). This is a psychological trait known as the recency bias, and it's one you should be aware of because it makes people think recent trends (like bull markets in the US or low valuations in the UK) will go on forever. Which of course they almost never do.
Let's move on to total expected returns to 2032, which depend on the starting price. Today's price is 7,200, so here are the expected returns from my central scenario:
With a starting value of 7,200:
- The FTSE 100 will produce a return from dividends of 48% by 2032
- The FTSE 100 will produce capital gains of 75% when it reaches 12,600
- The FTSE 100 will produce total returns of 123% by 2032, or 9.5% annualised (including but without reinvesting dividends)
Of course, if a bear market pushes the FTSE 100 down to 6,100, returns from that point will be even better.
From a starting value of 6,100:
- The FTSE 100 will produce a return from dividends of 57% by 2032
- The FTSE 100 will produce capital gains of 103% when it reaches 12,600
- The FTSE 100 will produce total returns of 163% by 2032, or 11.6% annualised (including but without reinvesting dividends)
A bear market would increase expected ten-year returns from 9.5% to 11.6%, so as usual, a bear market would be good for long-term investors who are still accumulating wealth.
But what about the impending recession, I hear you ask. Won't that cause earnings and dividends to decline?
Yes, it probably would. But history tells us that recessions have relatively little impact on the growth of average earnings over a ten-year period. Yes, in the short-term recessions are unpleasant, but over a decade or more they're almost irrelevant.
More than just being irrelevant, I think recessions are a necessary part of the economic cycle, as we found out when excessive efforts (by central banks and governments) to avoid recessions in the early 2000s led to a credit bubble and a global financial crisis in the late 2000s. And a decade of near-zero interest rates used to avoid weak economic growth have now caused all manner of asset bubbles and capital misallocations.
So while earnings and dividends may fall for a year or two, history suggests that average earnings are very likely to march upwards over the next decade, as they almost always have in the past.
On that basis, I think my scenario for 2032 is both realistic and conservative and I'm happy to invest in FTSE 100 companies at current valuations.
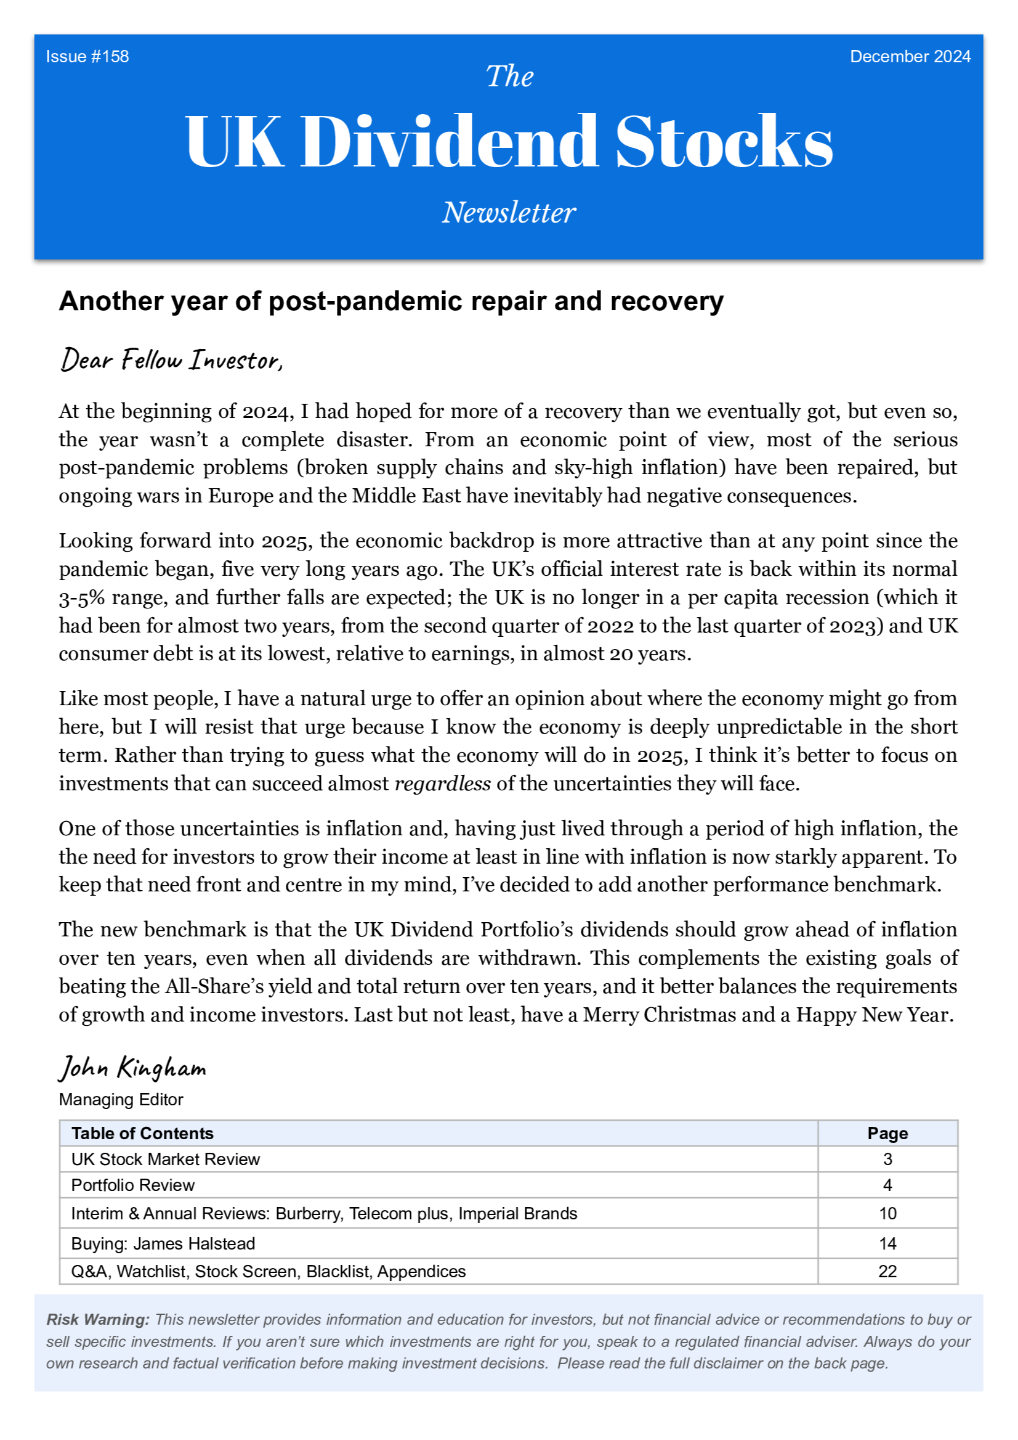
No time for spreadsheets or annual reports?
If you like this article but don’t have hours each month to dig through company accounts, you might find my monthly investment newsletter useful.
Once a month I send out a plain‑English PDF showing:
- The full UK dividend stocks model portfolio
- Which shares I’m buying, selling, trimming or topping up
- The latest news and trading updates for each holding
- Where we are in the stock market valuation cycle
All designed so a UK investor can stay on top of their dividend portfolio in well under an hour a month.
Get the latest blog posts & a free checklist
Get my latest articles in (at most) one email per week and download my dividend investing checklist. Topics usually include:
- Detailed reviews of high-quality UK dividend stocks
- Updates on my UK dividend stocks portfolio
- FTSE 100 and FTSE 250 valuations
- "How to" articles covering all aspects of dividend investing
No spam. Unsubscribe anytime.