Rio Tinto's shareholders are probably very happy.
Thanks to significantly higher prices for its core products of iron ore, aluminium and copper, the company's 2021 dividend comes to more than $10.
That's almost twice the previous record dividend and it gives Rio Tinto a dividend yield of almost 17% at its current share price of $62.
In GBP that's a dividend of almost £8.50 from shares costing £51 each, which is an eye-wateringly impressive yield.
Unfortunately, that huge dividend includes special dividends which are unlikely to be paid out on the same scale again. However, even if we ignore the special dividend, Rio Tinto still has a dividend yield of 13% from its ordinary dividend alone.
Of course, if you know anything about investing, you'll know that buying a stock simply because it has a very high dividend yield is usually a very bad idea.
Very high yields are often followed by very large dividend cuts, so instead of focusing solely on dividend yields, it's better to have a broader view of a company and its ability to pay dividends over the long term.
With that in mind, in the rest of this review, I'll walk you through how I approach the task of estimating Rio Tinto's future dividends, ending with an estimate of its fair value and how much I might invest in the company at its current price.
Table of Contents
- Rio Tinto has been one of the world's leading mining companies for 200 years
- Like most miners, Rio Tinto's growth has been volatile
- Operationally, Rio Tinto is a very stable business
- Over the medium term, price volatility trumps production stability
- China is the elephant in the room
- What happens to Rio Tinto when China goes ex-growth?
- The green industrial revolution will dwarf China's industrialisation
- Iron ore: No expected jump in demand, supply or prices
- Aluminium: Held back by its carbon-intensive production process
- Copper: The golden child of the green revolution
- Industrial Minerals: Too small to warrant a lengthy analysis
- Estimating Rio Tinto's overall earnings per share growth
- Estimating Rio Tinto's future dividends
- Estimating Rio Tinto's fair value using a discounted dividend model
- Calculating Rio Tinto's margin of safety and target position size
To set the stage, let's begin with a little history.
Rio Tinto has been one of the world's leading mining companies for 200 years
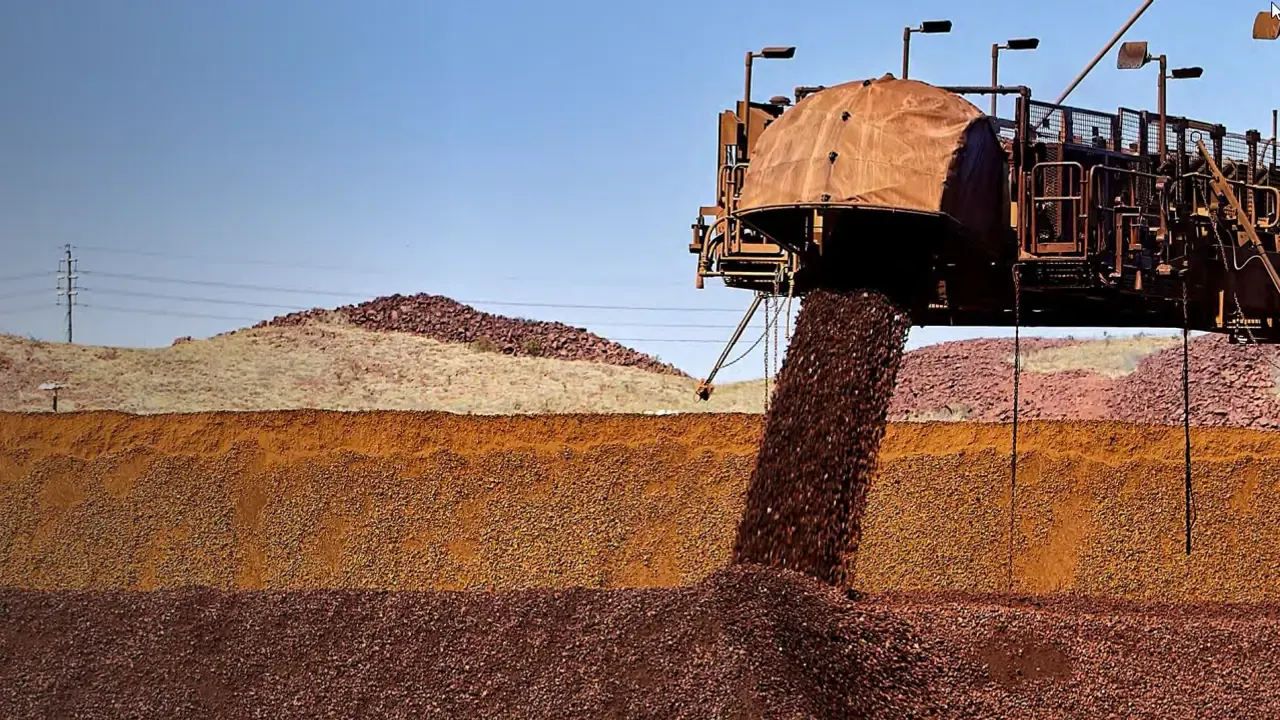
Rio Tinto gets its name from the Rio Tinto River in Spain. The name means red river and, because the river contains large quantities of dissolved iron, it is literally red. The river contains Iron because the surrounding area is rich in minerals and metals, including iron, copper, gold and silver, and it has been mined for at least 5,000 years.
After a period of disuse, the Spanish government restarted the mines in 1724, but their operations were inefficient. In 1873, the mines were sold to a consortium of investors led by Deutsche Bank and the Rio Tinto Company was born.
After World War I, the company began to diversify away from Spain through a series of joint ventures and acquisitions and eventually, it sold most of its Spanish operations in 1954.
Over the decades, these deals took Rio Tinto's operations into Africa, Canada and other countries, most notably Australia. In 1962, Rio Tinto Company merged with Consolidated Zinc, a significant Australian mining business, and in 1995 they became a dual-listed company in the UK and Australia and that structure remains in place today.
Rio Tinto's operations are now focused on mining iron ore, aluminium (bauxite) and copper, plus a range of other minerals and metals such as gold, silver, uranium and lithium. Over the last decade, around 80% of the company's earnings came from Iron ore, 10% came from aluminium, 5% from copper and 5% from other minerals and metals.
Like most miners, Rio Tinto's growth has been volatile
Understanding a company's long-term growth track record is important because it can give us useful insights into its competitive strengths and potential for future growth.
Unfortunately, this becomes more difficult if the company's performance has been volatile, and if you know anything about commodities, you'll know their prices can be extremely volatile.
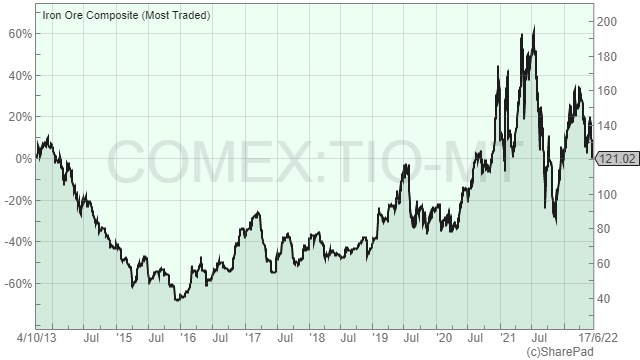
The chart above shows the price of Rio Tinto's core product (iron ore) falling by more than 70% from 2013 to 2016 and then increasing by almost 400% from 2016 to early 2021.
Compare that to Unilever (which is a holding in my personal portfolio and the UK Dividend Stocks Portfolio), where the price for Hellmann's Mayonnaise or Dove Soap rarely changes by more than a percent or three in any given year.
The volatility of iron ore prices makes it hard to assess Rio Tinto's underlying growth because its progress from one year to the next is primarily driven by the ups and downs of metal prices rather than whether the company sold more iron ore, aluminium and copper.
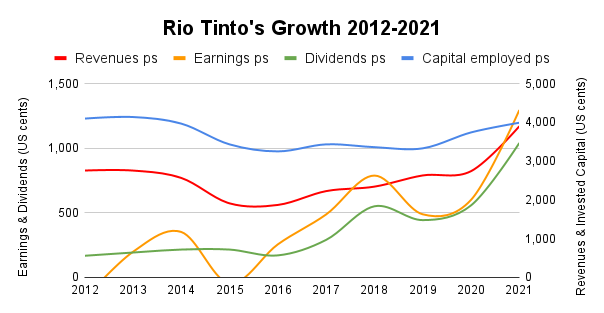
As you can see from the chart above, Rio Tinto's capital employed (equity + debt) and revenues followed a broadly similar path to iron ore prices over the last decade. They declined from 2013 to 2015 and then slowly recovered through to the end of 2021. But the story for earnings and dividends is very different because earnings and dividends grew extremely rapidly over the last ten years.
As ex-Bank of England Governor Mervyn King might say, what is going on here?
The first thing to note is that Rio Tinto's earnings were negative in 2012 and 2015. This was caused by various exceptional expenses, primarily a series of write-downs for previously acquired aluminium assets totalling a mind-boggling $20 billion (we'll revisit this huge mistake later).
We can strip out these non-cash and non-operational expenses by replacing reported earnings with the company's own "underlying earnings" figure. I usually ignore underlying earnings because in most cases they provide an excessively rose-tinted view of a company's performance, but in this case, it could prove useful. Here's the updated chart.
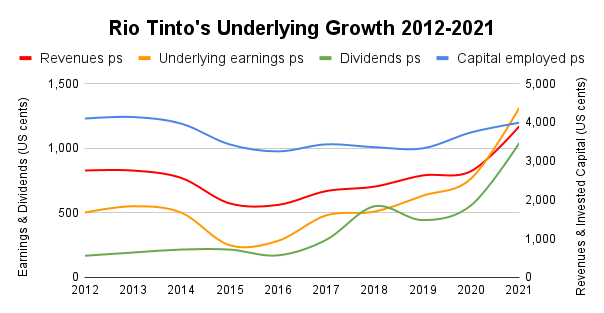
We can now see that revenues, underlying earnings and capital employed all declined and recovered broadly in line with iron ore prices. This means that even over a period as long as a decade, Rio Tinto's results have been driven by iron ore prices more than anything else.
This is bad news because commodity prices are volatile and unpredictable. If Rio Tinto's results are primarily driven by commodity prices, how can we say anything sensible about its potential for future dividends and growth? Fortunately, there might be a way.
Instead of looking at Rio Tinto's financial results, which are driven by unpredictable commodity prices, we can look at how many tonnes of iron ore, aluminium and copper it has produced over the years.
Production volumes have very little to do with commodity prices from one year to the next, so looking at production volumes should tell us quite a lot about the underlying growth rate of the company's productive capacity, with the volatility of commodity prices largely filtered out.
Operationally, Rio Tinto is a very stable business
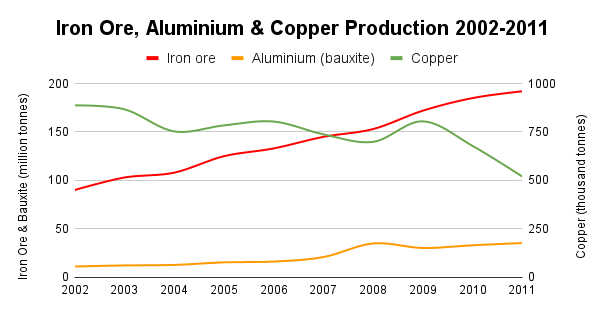
Here's a chart showing Rio Tinto's production volumes, focusing on its three main products of iron ore, aluminium (bauxite) and copper.

The first thing to note is that Rio Tinto's production volumes have been very stable from one year to the next. This is good because it means we may be able to forecast the company's future production volumes with a reasonable degree of confidence.
Looking at each of the three core products in turn:
- Iron ore production grew by an average of 4% per year, although growth has stalled since 2018
- Aluminium production grew steadily by an average of 4% per year
- Copper production was more volatile and declined by an average of 1% per year
As a quick sanity check, here are the production volumes from the previous ten years.
What this chart shows is another decade of steady production, so it seems reasonable to assume that Rio Tinto's production volumes will remain stable in the future.
Interestingly, the growth trends from the 2012-2021 period were already in place during the 2002-2011 period, only more so. For example, during 2002-2011:
- Iron ore production grew by an average of 8% per year (vs 4% from 2012-2021)
- Aluminium production grew by an average of 15% per year (vs 4% from 2012-2021)
- Copper production declined by an average of 3% per year (vs a 1% annual decline from 2012-2021)
The 15% growth rate for aluminium production from 2002 to 2011 is particularly impressive, but much of this was due to the 2007 acquisition of Alcan for $38 billion. Unfortunately, this acquisition turned out really badly. The $38 billion price tag was way too high and led to the $20 billion write-downs I mentioned previously.
When the acquisition was made, Rio Tinto was earning an average of $4 billion per year, so the purchase price was ten times Rio Tinto's average earnings.
That breaks one of my rules of thumb by an enormous margin:
- Rule of thumb: Be wary of companies that spend more on acquisitions than they make in profit
Turning back to Rio Tinto's production volumes, they're very stable and that's good because they give the company a stable foundation for producing future earnings and dividends.
However, although it's useful to strip away commodity prices so we can see what's going on underneath, Rio Tinto is a mining company and its results are heavily influenced by commodity prices, so to ignore them completely would be madness.
Given their importance, let's have a look at how metal prices have affected the company's results over the last ten or twenty years.
Over the medium term, price volatility trumps production stability
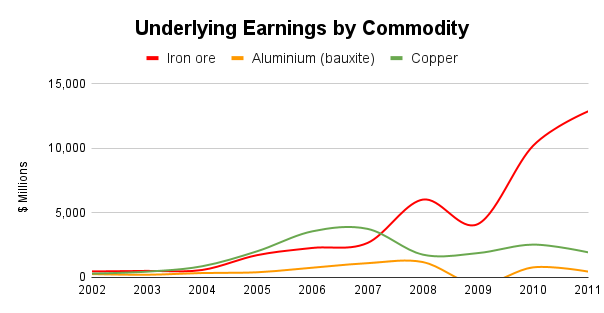
The previous chart showed Rio Tinto's iron ore production volumes increasing very steadily from 90 million tonnes in 2002 to 192 million tonnes in 2011. That means iron ore production slightly more than doubled in a decade, which is a decent enough growth rate.
In contrast, underlying earnings from iron ore went from $458 million in 2002 to $12,853 million in 2011. That's an increase of 2,700% in a decade, which is nothing short of astonishing.
So how does that happen? How do underlying earnings go up 2,700% when underlying production volumes only went up 113%?
The answer, of course, is that iron ore prices went up. And they didn't just go up a bit, then went into the stratosphere.
For example, in 2002, the price of a tonne of iron ore was around $10, but by 2008 it had increased to a previously unthinkable $195. That's a 20-fold increase and it was almost entirely responsible for Rio Tinto's 27-fold increase in iron ore earnings.
And it wasn't only the price of iron ore that went up. Copper went up seven-fold between 2002 and 2011 and aluminium more than doubled from 2002 to 2008. But the gains in iron ore prices were by far the largest and by the end of that period, Rio Tinto had been transformed from a diversified miner into one almost entirely dependent on iron ore.
So, commodity prices can change dramatically over a ten-year period and that can have a dramatic effect on where Rio Tinto gets most of its profits.
On that basis, it seems clear that if we are to have any opinion on Rio Tinto's future prospects, we need to form an opinion on where the price of iron ore, aluminium and copper are likely to be in the future.
And to do that, we'll need to understand what drives commodity prices over the medium and longer term. One way to explore this topic is to look back to the 2002-2011 period to understand why iron ore prices went up 20-fold.
China is the elephant in the room
It is no mere coincidence that iron ore prices exploded during the 2000s, just as China's industrialisation was driving a construction project perhaps an order of magnitude larger than anything this planet has ever seen.
Industrialising a country with a population of 1.4 billion takes a lot of steel, so China became the global leader in steel production. And all that steel needs a lot of iron ore, so China's iron ore imports went from about 100 million tonnes in 2002 to about 700 million tonnes in 2011.
For context, global iron ore production in 2002 was about 1,000 million tonnes and by 2011 it had increased to about 1,900 million tonnes, which means China was importing about 10% of the global iron ore supply in 2002 and almost 40% by 2011.
To put it bluntly, China's industrialisation led to a phenomenal increase in demand for iron ore.
For most products, an increase in demand isn't a big deal:
- If demand for a product goes up, suppliers can charge higher prices and earn higher profits
- Those higher profits will attract additional supplies so overall supply soon increases
- The increase in supply reduces prices and profits to normal levels, at which point supply stops increasing
If we're talking about cars or covid masks then supply can usually increase or decrease to match demand in a matter of months. But for products like iron ore, it can take many years for supply to adjust to an abrupt increase in demand.
That's because opening a very large mine is extremely hard, expensive and time-consuming. You can't just flick a switch and bring on another 10 million tonnes of iron ore supply. You have to:
- Find the iron ore deposits, which can take years
- Get through all the various negotiations with local communities and other stakeholders, which can take years
- Put lots of heavy infrastructure in place, perhaps even building hundreds of kilometres of railway and a shipping port to transport the iron ore to customers (which can take years)
To use the jargon, the supply of iron ore, aluminium and copper is inelastic. When demand for iron ore goes up, as it did when China industrialised, supply doesn't respond in a timely manner. Because of that lag, prices exploded from $10 to $195.
For Rio Tinto and its shareholders, this was like winning the lottery. Prices went sky high, but because supply takes so long to come on stream, prices and profits remained extraordinarily high for years.
Inevitably though, this sort of thing doesn't go on forever. Eventually, supply does catch up with demand and eventually demand does begin to ease, but because supply is inelastic in both directions (slow to increase and slow to decrease), this can cause prices and profits to collapse.
That's precisely what happened after Rio Tinto acquired Alcan in 2007. Demand fell during the global financial crisis and supply was able to catch up with demand, so prices fell and Rio Tinto had to write off $20 billion of shareholders' money.
The big risk for Rio Tinto is that something like that might happen with iron ore. In other words...
What happens to Rio Tinto when China goes ex-growth?
At the height of its construction boom, China was putting up some simply astonishing numbers:
- In 2009, China invested $3.5 trillion in new buildings, roads and railways
- In 2011, the 12th five-year plan targeted 26 million new homes, 83,000km of new roads and 45,000km of new railways
- By 2012, China was producing more steel than the rest of the world combined (and that continues to be the case today)
All of this kept iron ore prices above $150 per tonne for much of 2008-2011.
But after three decades of near double-digit annual growth, China succumbed to the inevitable limits to exponential growth on a finite planet.
Having exceeded a 10% growth rate for the last time in 2010, its growth rate has consistently declined towards 5% and nobody knows where that decline will stop (thanks to its one-child policy and a preference for boys over girls, China's population is expected to enter a long decline somewhere around 2030).
So demand growth slowed, but new mines were still coming onstream and eventually, the world became awash with iron ore and steel. The inevitable price collapse arrived during 2014-2016, as the chart below shows.

Prices briefly fell below $40 per tonne and even though much of Rio Tinto's iron ore production was still profitable at that price, it was obviously much less profitable than before. This is why Rio Tinto's revenues and underlying earnings fell during the middle of the last decade.
However, after the price collapse, things started to look up. Iron ore prices began to recover and by 2019 they were consistently close to $100 per tonne. Rio Tinto's revenues and underlying earnings recovered back to pre-price-crash levels and (importantly for dividend investors) the company's dividend was only reduced for a single year (by 20% in 2016), after which the dividend has increased significantly.
So China's transition from rapid industrialisation to the more sedate growth of a mature modern economy did have a negative impact on Rio Tinto for several years, but the impact was neither catastrophic nor permanent.
Note: If you'd like to know more about the impact of China on the price of iron ore, there's an excellent summary called The Iron Ore Price Wars: 2002-2017.
The whole point of this jaunt through history was to better understand what drives iron ore, aluminium and copper prices.
The summarised version is that demand for these metals is very stable and growing slowly, unless there is a dramatic change in the physical side of our global economy, such as the rapid industrialisation of China.
Extrapolating that into the future, my basic assumption is that demand for iron ore, aluminium and copper will continue to grow as the global population grows (perhaps to 11 billion by the end of this century) and continues to urbanise.
But will there be another massive change to global infrastructure in, say, the next ten or twenty years that could have a dramatic impact on metal prices?
Rio Tinto says the answer is yes: The expected transition to a "green" global economy could be a key driver of both demand and prices for metals over many decades.
The green industrial revolution will dwarf China's industrialisation
To have just a 50/50 chance of keeping global warming to less than 1.5 degrees above pre-industrial levels, we need to reduce the global economy's greenhouse gas emissions to net zero by 2050.
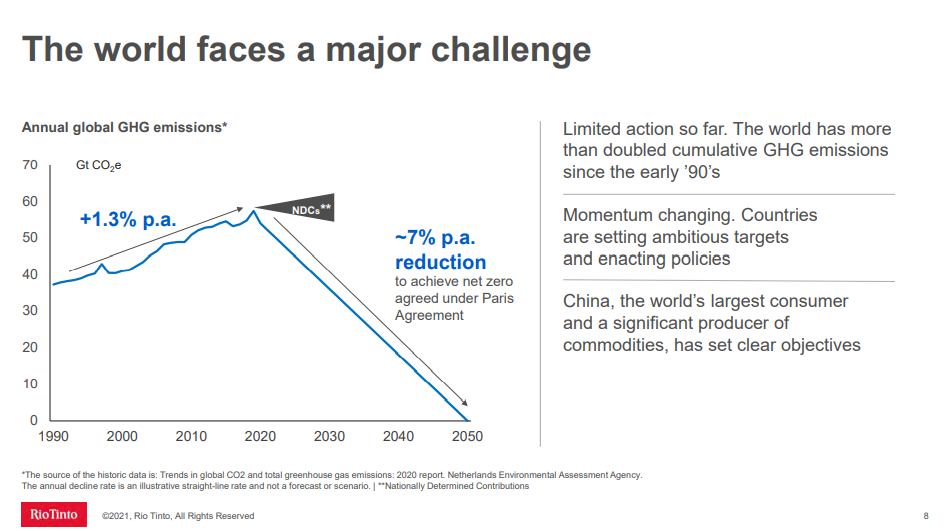
There are various ways to achieve this, but according to the International Energy Agency (IEA), the world will need to be adding an additional 630 gigawatts of solar power and 390 gigawatts of wind power, every year, by 2030. That's more than four times the current expansion rate and requires the equivalent of installing the world’s current largest solar park every single day, for years.
It will also require annual investment in emission-reducing infrastructure to increase from $1 trillion today to more than $4 trillion every year for the next few decades,
This will be the largest engineering and construction project the world has ever seen, by a country mile, so it could have a significant impact on the demand for and price of iron ore, aluminium and copper. But what sort of impact might it have?
Iron ore: No expected jump in demand, supply or prices
Let's begin with iron ore because it's Rio Tinto's core product. I'll also start with supply because that's the easiest thing to forecast.
As I've already said, the supply of these commodities tends to be stable because it takes time to expand or open mines. For context, Rio Tinto increased its iron ore supply by 9% per year from 2002 to 2011 and by 4% annually from 2012 to 2021.
Looking forward, it seems likely that supply will grow more slowly.
For example, even if we do manage to build enough wind turbines to reach net zero by 2050, the IEA forecasts global steel production to increase from around 1,850 million tonnes today to around 1,950 million tonnes by 2030. That's a growth rate of just 0.5%.
"Driven by population and GDP growth, global steel demand will likely recover and continue to increase. This is especially because of economic expansion in India, the ASEAN countries and Africa, even as demand in China is expected to peak and begin to decline within the next few years." - International Energy Agency
Other forecasts have steel production growing slightly faster, but some predict a peak in global iron ore production by 2030 because:
- The global rate of urbanisation has already peaked, with more than 55% of the global population already living in cities
- Less steel will be used per building or car through improved design
- Steel will last longer thanks to the wider use of coatings and alloys
- A greater proportion of steel will be recycled as the circular economy becomes the norm
- We will increasingly use alternatives such as aluminium
So the outlook for iron ore production is uncertain, but most forecasts suggest a very low growth rate.
As for demand, the IEA and others don't expect demand to differ materially from demand.
That has a direct impact on the expected price of iron ore because if supply and demand are broadly in balance there is no obvious reason to expect the price to go up or down significantly compared to where it's been in the past.
The World Bank, for example, has forecast the price of iron ore to be $90 per tonne in 2030, which is close to (and probably based on) the average of the last ten years. $90 is also below the current price of $120 per tonne, which is still elevated thanks to covid-related supply/demand disruptions.
While it may seem like a cop-out to base price forecasts on historical averages, in reality, commodity prices are about as predictable as share prices (i.e. not at all predictable) so using past prices as a baseline is sensible.
Given all of the above, here are my assumptions for Rio Tinto's iron ore operations over the next decade:
- Iron ore production increases steadily, by 1% per year
- Iron ore earnings per tonne revert to the average of the last decade (as covid-induced issues subside) and then increase by 2% per year (in-line with the inflation target of many central banks)
Aluminium: Held back by its carbon-intensive production process
For some context, this chart shows aluminium prices over most of the last decade:
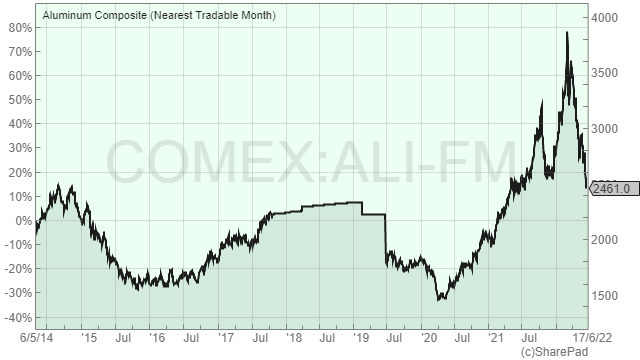
Aluminium has properties which will be useful in the transition to net zero, such as lightweight for efficient vehicles and corrosion resistance for solar panel frames. This should give the metal a brighter future than steel (and therefore iron ore).
To some extent, this has already been true, with global aluminium production roughly doubling over the last decade, fuelled by China's industrialisation.
However, looking forward, the IEA forecasts global aluminium production to grow by about 8% by 2030, or about 1% per year, in a world where we reach net zero by 2050.
This growth forecast seems low for such an attractive metal of the future, but aluminium is very carbon-intensive to produce, with around 15 tonnes of carbon dioxide emitted for every ton of aluminium. If the world is to reach net zero by 2050, the carbon cost of ramping up aluminium use would outweigh the benefits.
Rio Tinto is trying to address this issue in various ways, such as ELYSIS, a joint venture to commercialise and scale up a method of smelting aluminium that produces no greenhouse gases. Unfortunately, this is still a very early-stage project.
An easier way to reduce the carbon intensity of aluminium is to recycle it as part of the circular economy. The more recycling the world does the less carbon we will emit, but this will also reduce demand for primary aluminium from producers like Rio Tinto and this is another reason why aluminium production is only forecast to grow by 1% per year.
Given aluminium's expected low growth rate, it seems likely that supply will easily keep up with demand, and with supply expected to keep up with demand, my baseline assumption is that prices remain at historically normal levels.
The World Bank agrees and has forecast aluminium to reach $2,400 per tonne by 2035, compared to an average of about $2,000 over the last decade. The current price is $2,500, so the World Bank is effectively saying it expects no sustained increase in aluminium prices over the medium term.
Based on the above, here are my assumptions for Rio Tinto's aluminium operations over the next decade:
- Aluminium production will grow steadily, at 1% per year
- Aluminium earnings per tonne will revert to the average of the last decade (as covid supply/demand issues subside) and then increase in line with inflation, at 2% per year
Copper: The golden child of the green revolution
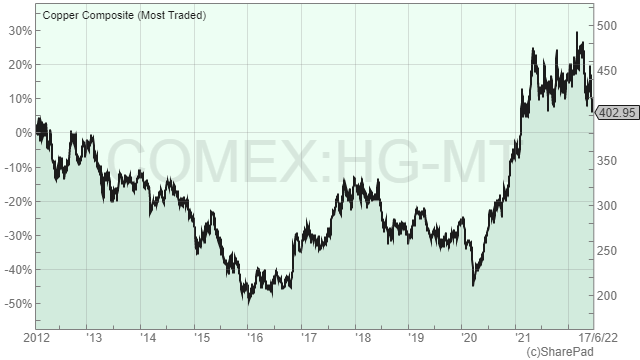
Of Rio Tinto's core products, copper is likely to be by far the greatest beneficiary of a world where electricity becomes the dominant form of energy.
"The energy transition requires substantial quantities of critical minerals, and their supply emerges as a significant growth area. The total market size of critical minerals like copper, cobalt, manganese and various rare earth metals grows almost sevenfold between 2020 and 2030 in the net zero pathway. Revenues from those minerals are larger than revenues from coal well before 2030. This creates substantial new opportunities for mining companies. It also creates new energy security concerns, including price volatility and additional costs for transitions, if supply cannot keep up with burgeoning demand." - IEA Net Zero by 2050
Under its sustainable development scenario (slightly less aggressive than the net zero 2050 scenario), the IEA forecasts copper demand to increase from 21 million tonnes in 2020 to 25 million tonnes in 2030, equivalent to demand growth of 2% per year.
Forecasts from Rio Tinto and others suggest significantly higher demand growth for copper if the world is to reach net zero by 2050, with copper demand forecast to reach 35 million tonnes by 2030, a growth rate of about 5% per year.
As the chart below shows, the world's existing copper mines and those in the pipeline could struggle to keep up with that level of demand growth and that could have a dramatic impact on the price of copper.
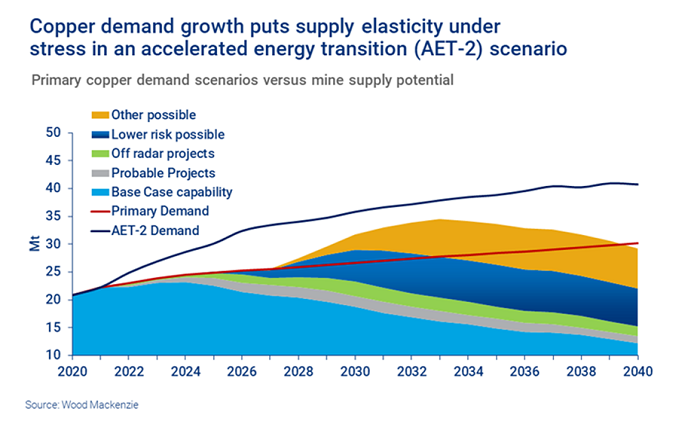
However, if the IEA forecast of 2% growth proves more accurate and copper demand only grows to 25 million tonnes by 2030, the above chart suggests we could meet that demand without serious problems.
What does all this tell us about the future price of copper?
As always, it's near-impossible to know. If supply can meet demand then prices may only increase (in a very volatile fashion) in line with inflation. But if demand cannot consistently meet demand then prices could skyrocket.
The World Bank's 2030 forecast has the price of copper close to its average over the last decade at $7,000 per tonne. As with its forecasts for iron ore and aluminium, that's below the current price of $9,000 per tonne which is elevated because of covid-related supply/demand issues.
Given these uncertainties, I think it's reasonable to assume that copper prices will increase at least in line with inflation, with the uncertainty skewed to the upside.
Based on all of that, here are my assumptions for Rio Tinto's copper operations over the next decade:
- Copper production grows steadily, by 2.5% per year
- Copper earnings per tonne revert to the average of the last decade (as covid-induced supply/demand issues subside) and then increase by 3% per year
Industrial Minerals: Too small to warrant a lengthy analysis
In addition to iron ore, aluminium and copper, Rio Tinto also produces a range of other industrial minerals and products, primarily iron ore pellets, titanium oxide, borates and diamonds.
Given that this part of the business only generates around 5% of the company's underlying earnings, it doesn't make sense for me to spend endless hours analysing each of these products and their potential futures.
A much simpler approach is to look back at the growth of Rio Tinto's minerals business over the last two decades and extrapolate that into the future. Yes, this isn't perfect, but given the relative unimportance of this part of the business, I think this is a reasonable fudge.
Starting with the 2002-2011 period, Rio Tinto's industrial minerals business generated average total earnings of $350 million per year. During 2012-2021 it produced average underlying earnings of just under $600 million. That's equivalent to an annual growth rate of 5.5%.
On that basis, here's my assumption for Rio Tinto's industrial minerals business:
- Underlying earnings revert to the average of the last ten years (as supply/demand issues subside) and then grow by 5.5% per year
We now have some forward-looking estimates of what Rio Tinto's earnings might look like in the future and we are beginning to close in on the end goal, which is an estimate of the company's future dividends and therefore its fair value today.
But first, let's bring all of the above assumptions together so we can see what they say about the company overall.
Estimating Rio Tinto's overall earnings per share growth
By entering all of those assumptions into an investment spreadsheet, it's easy to produce a model for Rio Tinto's underlying earnings growth over the next decade. And here it is:
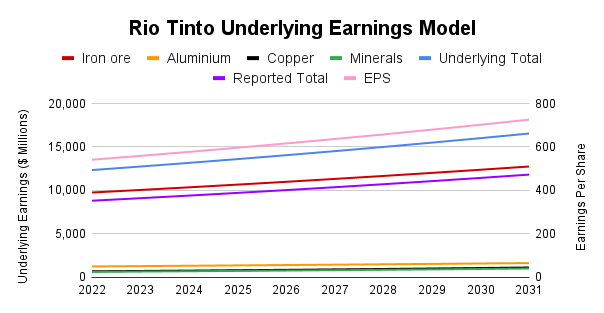
The first thing to note is that the lines on the chart are all nice and straight, but in reality, Rio Tinto's earnings will be anything but straight. It's important to remember that these lines simply represent an estimate of the average of the ups and downs that might happen in reality.
Second, the chart suggests that Rio Tinto's results will still be dominated by iron ore (RED) for many years to come, while aluminium (AMBER), copper (BLACK) and industrial minerals (GREEN) continue to make up a small part of the company's total earnings.
Here's a quick summary of the main figures:
- Reported earnings (PURPLE) fall from $21 billion today to $8.8 billion in 2022 as the post-covid chaos comes to an end. That's a big decline but it's still above 2019's earnings
- Reported earnings grow from $8.8 billion in 2022 to $11.8 billion in 2030, a growth rate of 3.3% per year
- Earnings per share (PINK) grow from $5.41 in 2022 (compared to a sky-high $13 in 2021) to $7.02 in 2030
Looking back at the company's past record and given the level of uncertainty inherent in a company like this, I think this model meets my criteria of being both reasonable and conservative.
With this earnings model in place, we can now start to think about the level of sustainable dividend Rio Tinto could pay in the future.
Estimating Rio Tinto's future dividends
To estimate the sort of dividend Rio Tinto might be able to pay, it can be helpful to think of Rio Tinto, or any company, as a type of savings account.
It works like this: If I have a savings account with a 10% interest rate and I want that account to grow by 10% per year, I'll have to reinvest all of the interest payments (or add in some new savings, but let's ignore that option for now). But if I only need the account to grow by 5% then I only need to reinvest half of the interest payment and I can take the other half in cash and spend it on whatever I like.
To translate this into companies, think of the savings as capital employed, the interest rate as return on capital employed, the interest payments as earnings and the interest withdrawn as dividends.
The starting point is capital employed, which for Rio Tinto is currently about $40 per share.
Rio Tinto generated average returns on capital employed of 12.6% during 2002-2011 and 11.6% during 2012-2021, so let's assume a future return on capital of 12%.
If I plug those figures into a dividend model, I can then adjust the growth rate by adjusting the amount of earnings retained within the business versus the amount paid out as dividends. I can do this by adjusting the dividend cover and my goal is to get the growth rate in this model to match the growth rate from the previous "top-down" model that was based on production volumes and metal prices.
Here's what the model looks like if I set the dividend cover to 1.5.
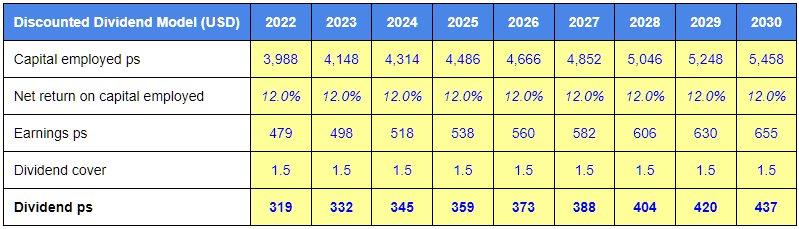
This model is slightly more pessimistic than the "top-down" model, with EPS going from $4.79 to $6.55 compared to an increase from $5.41 to $7.02 in the previous model. However, the difference is only around 10%, so I think this model is in the right ballpark. Also, I want my models to be realistic but conservative, so I'm comfortable with this model being slightly more pessimistic.
In terms of dividends, the model says Rio Tinto could afford to pay a progressively increasing dividend, going from $3.19 in 2022 to $4.37 by 2030.
$3.19 is a long way below the record $10 total dividend paid in 2021 and it's also a long way below 2021's $7.93 ordinary dividend, but that huge dividend was only possible because of the recent surge in inflation. Personally, I don't think a $7.93 ordinary dividend is even remotely sustainable, and here's why:
Inflation has an immediate upward impact on the cost of metals, so Rio Tinto's revenues exploded along with metal prices. But it takes time for that inflation to pass through from primary goods like iron ore to the manufactured goods (like trucks) and services (like employees) that make up Rio Tinto's expenses.
Because of that, revenues surged ahead of expenses, which led to windfall profits and record dividends for miners and oil & gas companies. However, input costs will eventually go up with inflation, so margins will eventually return to more normal levels and so will earnings and dividends.
On that basis, I think my model's $3.19 dividend estimate for 2022 is reasonable. It will be wrong, of course, but that's okay because it's the estimate of long-term dividends that matters. And just out of interest, a $3.19 dividend would give the company a still-healthy dividend yield of 5.1% at its current £51 ($62) share price.
The bulk of the dividend model is now in place, so all we need to estimate Rio Tinto's fair value is an estimate of its terminal or perpetual growth rate beyond 2030.
Of course, it's impossible to know what the true figure will be, but as a large and established global business, I would expect its long-term growth rate to be similar to the background growth rate of the global economy.
Given that global population growth is likely to materially slow after 2050, I'm going to assume a 1% real long-term growth rate for the global economy as a whole, or 3% if we include the 2% inflation target.
For a volatile business such as Rio Tinto, I'm going to be pessimistic and assume it won't grow faster than the global economy after 2030. In other words, I'll assume it can grow by 3% per year after 2030 essentially "forever".
With all of that in place we can now estimate Rio Tinto's fair value and, at long last, decide if the current price is attractive or not.
Estimating Rio Tinto's fair value using a discounted dividend model
Fortunately, this is the easy bit.
I won't belabour this point, but in theory, a company's value is equal to the sum of all its future cash returns to shareholders (mostly dividends), discounted by your desired rate of return.
We can calculate this using a discounted dividend model, and if you have no idea what a discounted dividend model is I've written a couple of articles on the subject on my old website:
- How to value shares with the Dividend Discount Model
- The pros and cons of discounted dividend models
For me, "fair value" is the value of those future dividends discounted by the stock market's average rate of return, which is 7% in the UK.
"Good value" is the value of those future dividends discounted by my target or hurdle rate of return, which is 10%.
All we have to do is plug all of the previous figures into a discounted dividend model (like the one in my investment spreadsheet) and it will calculate fair value and good value prices for the company. Here are the results for Rio Tinto:
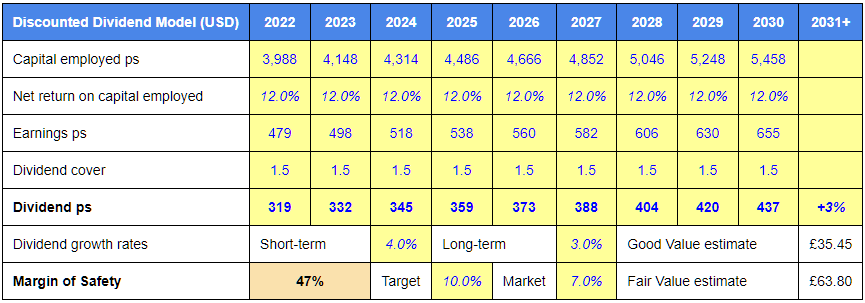
The table says that if the model turned out to be 100% accurate (which of course it won't), then the following would happen:
- Good Value: Buying Rio Tinto at £35.45 would give an expected annualised long-term return of 10%
- Fair Value: Buying Rio Tinto at £63.80 would give an expected annualised long-term return of 7%
The current share price is £51, so it's towards the middle of good and fair value and therefore the expected return (according to this model) is also near the middle of 7% and 10%. Also, the estimated dividend yield for 2022 is around 5%, so that's an added attraction for income investors.
In summary, Rio Tinto is trading below my estimate of fair value, but is it far enough below fair value to make me want to invest?
Calculating Rio Tinto's margin of safety and target position size
It isn't enough to say that a company is trading below fair value. We need to know how far below fair value it's trading and that's where the margin of safety concept comes in.
There are various ways to define a margin of safety, but for me, if a company is trading at fair value then its margin of safety is zero and if it's trading at my good value estimate then its margin of safety is 100%. Between those two points the margin of safety increases gradually from zero to 100%.
With Rio Tinto's £51 share price sitting near the middle of my fair value (£35) and good value (£64) estimates, it should come as no surprise that its margin of safety is 47%. 47% is quite good, but it isn't enough to make me want to invest at the current price.
Here are my rules of thumb for buying, selling and holding, in terms of the margin of safety:
- SELL if the margin of safety is below 33%
- HOLD if the margin of safety is between 33% and 66%
- BUY if the margin of safety is above 66%
Rio Tinto is squarely in the HOLD range, so if I already owned it I'd be happy to keep holding it, but I wouldn't buy it at the current price.
If the price fell below £45 ($55) then in theory I might be interested as the margin of safety would be 66%. In reality, I probably wouldn't invest unless the price was close to £35 and the margin of safety close to 100%.
There are two reasons for that.
First, investors are very pessimistic at the moment and stocks have fallen a long way, so many of the holdings in the UK Dividend Stocks Portfolio (which my personal portfolio mirrors) have margins of safety close to or above 100%.
Why would I put money into Rio Tinto if its margin of safety was 66% when I can top up existing holdings that have margins of safety above 100%? The answer is that I wouldn't.
Second, I adjust position sizes based on each holding's defensiveness and margin of safety. For example:
- Defensive holdings have a default position size of 4%
- Cyclical holdings have a default position size of 3%
- Highly cyclical holdings have a default position size of 2%
As a highly cyclical commodity business, Rio Tinto would have a default position size of 2%, which is very small given that I'm only looking to hold 20 to 25 companies.
This default size is then adjusted up and down depending on the margin of safety and therefore the attractiveness of each holding's valuation.
- When the margin of safety is 100% the target size is double the default size
- When the margin of safety is 50% the target size equals the default size
- When the margin of safety is zero the target size is half the default size
With Rio Tinto's margin of safety close to 50%, its target position size would be close to the default of 2% and having a holding with a 2% position size, in my opinion, just isn't worth it.
I'd have to do all the work of keeping up to date with the business and adjusting its dividend model, but the investment would only make up a measly 2% of my portfolio. I can justify that effort for holdings that make up 6% or 8% of my portfolio, and perhaps even as low as 4%, but much less than that and I don't think it's worth the effort.
If Rio Tinto's price fell below my good value estimate of £35 then its margin of safety would increase to 100% and its target position size would increase to 4%, and at that point, I can justify the effort. But if the price doesn't go that low then I'm not interested.
Having said all that, after spending a fair bit of time looking at this business, I do think it ticks most of the boxes from my investment checklist and I do think I would invest at the right price. On that basis, I'll be adding Rio Tinto to my watchlist where I can keep it under review.
No time for spreadsheets or annual reports?
If you like this article but don’t have hours each month to dig through company accounts, you might find my monthly investment newsletter useful.
Once a month I send out a plain‑English PDF showing:
- The full UK dividend stocks model portfolio
- Which shares I’m buying, selling, trimming or topping up
- The latest news and trading updates for each holding
- Where we are in the stock market valuation cycle
All designed so a UK investor can stay on top of their dividend portfolio in well under an hour a month.
Get the latest blog posts & a free checklist
Get my latest articles in (at most) one email per week and download my dividend investing checklist. Topics usually include:
- Detailed reviews of high-quality UK dividend stocks
- Updates on my UK dividend stocks portfolio
- FTSE 100 and FTSE 250 valuations
- "How to" articles covering all aspects of dividend investing
No spam. Unsubscribe anytime.