
As a dividend investor, I'm looking to invest in good companies with high yields, but high yields are usually only available when investors are pessimistic about a company's prospects.
If investors are right to be pessimistic, an alluringly high yield may turn out to be a mirage that disappears when the company suspends its dividend. Even worse, a high yield could be a siren call that lures unwary investors into a stock that is about to go to zero.
There are many reasons why these “dividend traps” cut or suspend their dividends, but one common reason is that they have too much debt. The obvious way to avoid that risk is to only invest in debt-free companies, but that isn't always the right answer either.
In my experience, there is a sweet spot between having no debt (which reduces risk but also reduces potential returns) and having too much debt (which increases potential returns but also increases risk), so in this post I'll explain the two ratios I use to identify companies operating in that sweet spot.
Note: This blog post is part of a series where I take a detailed look at my dividend investing strategy. The last post looked at how to find quality dividend stocks using two profitability ratios.
Table of contents
- Measuring the risk of a debt default
- Comparing total debt to average earnings
- Next is a retailer with surprisingly little debt
- Taking account of defined benefit pension risk
- BT has a supermassive “pension black hole”
- Summary: Beware of excessive debts and pension liabilities
Measuring the risk of a debt default
The main risk that comes with having too much debt is that the interest payments will become unaffordable if the company's profits decline for one reason or another. Lenders are aware of this, so they’ll often attach covenants to loans, which are contractual obligations that the borrower must stick to.
Typically, debt covenants stipulate that the borrower must keep the ratio of profit to interest or profit to debt above a certain level. If the borrower breaks these covenants, the lender can take various actions, such as demanding full repayment within a relatively short period of time.
When I’m looking at a company’s debt profile, I look at it from the point of view of a lender because I’m interested in the same thing as a lender:
I only want to put my money into companies that can easily afford the interest on their debts and easily repay their debts in good times or bad.
Comparing total debt to average earnings
There are many debt ratios to choose from, but I use the ratio of total debt to average earnings:
- Total debt = Borrowings + lease liabilities
- Average earnings = ten-year average post-tax profit
- Debt Ratio = total debt / average earnings
This ratio tells me how many years it would take a company to pay off all borrowings and lease liabilities if it continued to generate historically average earnings.
I wrote about lease liabilities at length in the previous post on profitability ratios, but as a quick reminder, they are a form of debt where companies effectively borrow stores or other productive assets from lessors (typically landlords).
Most debt ratios compare debt to last year’s earnings, but earnings can vary a lot from one year to the next, so those ratios can give misleading results. To avoid the negative impact of earnings volatility, I compare debt to earnings averaged over ten years, and you can think of this as a relatively conservative estimate of “normal” earnings.
For high-growth companies, that estimate of normal earnings will be even more conservative because their ten-year average earnings will be much lower than their current earnings.
This additional conservatism with high-growth companies is deliberate because debt tends to exacerbate other risks, and faster growth usually comes with higher risks (in the same way that faster driving usually comes with higher risks).
To keep things simple, I just refer to this ratio as the Debt Ratio and as with most of my metrics, I use good, okay and bad ranges to help me decide whether I'm looking at a good, okay or bad business:
- Good = Below 4
- Okay = Between 4 and 6
- Bad = Above 6
At a bare minimum, I want to avoid companies with bad characteristics, such as excessive debt. That leads to the following rule of thumb:
- Rule of thumb: Only invest if the Debt Ratio is below 6
Let’s take this rule and apply it to a well-known company that I currently hold in the UK Dividend Stocks Portfolio.
Next is a retailer with surprisingly little debt
Next is one of the UK’s leading clothing and homewares retailers, and I used it as the example company when I wrote about my profitability ratios. Next still has a significant number of physical stores, so it should be an interesting example as it has a meaningful amount of both lease liabilities and borrowings.
To calculate the Debt Ratio, we need earnings (net profit, which you'll find on the income statement), borrowings and lease liabilities (which you'll find on the balance sheet).
Looking at the raw numbers, Next currently has:
- Borrowings of £893 million
- Lease liabilities of £1,023 million
- Total debts of £1,916 million
- Ten-year average earnings of £598 million
This gives Next a Debt Ratio of 3.2, which puts it in the "good" range.
The company’s relatively small lease liabilities are particularly interesting, as this is one area where many store-based retailers go wrong.
Weak retailers will often try to improve their weak profitability by reducing their monthly lease costs, and one way to do that is to sign very long lease agreements. Landlords are happy to charge lower rents in exchange for locking in a tenant for ten or 20 years, but this also locks the retailer into a fixed store estate that cannot easily be adapted to a rapidly changing world.
In contrast, high-quality retailers with high profitability can afford higher rents, so they can sign leases that are much shorter and more flexible. In Next’s case, its outstanding lease commitments extend a mere 4.7 years into the future, and more than 91% of its leases will expire in less than ten years.
So, Next clearly has very little debt for a retailer, but has that always been the case? Perhaps last year was an anomaly where its debts were unusually low, and perhaps they’ll rebound to unacceptable levels within a year or two?
That does sometimes happen, so it’s useful to look at how a company’s debts have evolved over time.
To see if this is the case with Next, here’s a chart showing its debts over the last ten years.
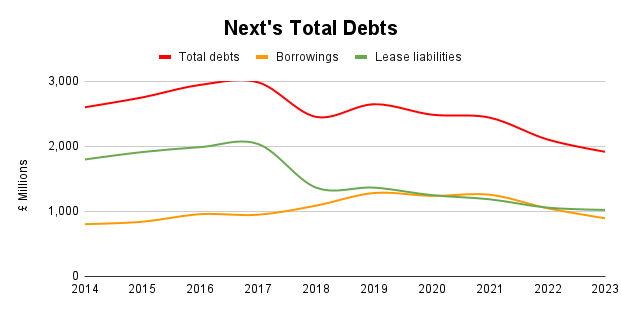
Data source: SharePad
The chart shows that Next’s debts have been declining fairly steadily in recent years, even though the company has been growing its revenues and earnings.
This is because, like most retailers, Next has spent the last few years shrinking its store estate as the world rapidly shifts from in-store to online shopping, and fewer stores obviously means fewer leases.
In addition, a reduction in demand for physical stores across the UK has led to a reduction in rents. Last year, for example, Next saw rent on renewed leases fall by an average of 30%.
In summary then, Next has very little debt, and its debts are falling while the company is growing, which is a very attractive combination.
Taking account of defined benefit pension risk
Defined benefit pensions are another form of debt, at least for companies that offer them (many companies only offer defined contribution pensions, which I don’t care about because they’re relatively risk-free from the company’s point of view).
Defined benefit pensions offer employees a pension that is typically based on their salary. As employees toil away each month, the employer and/or employee will put a small amount of money into the pension pot, building up assets that will be used to fund pension payments in the future.
This means that defined benefit pension schemes have assets (employee/employer savings) and liabilities (the expected future pension payments), and both are recorded in the accounting notes at the back of each annual report.
Ideally, there will be a small surplus of pension assets over pension liabilities, which means the pension scheme is “fully funded”. But this isn’t always the case. Sometimes, a pension scheme’s assets will be smaller than its liabilities, which means the scheme is in deficit, and this is where the problems begin.
If there is a pension deficit, the company is legally obliged to reduce that deficit, usually by injecting cash into the pension fund. This means that for practical purposes, pension deficits are just another form of debt that has to be repaid.
To take account of this, I always check to see if a company has a defined benefit pension scheme and a related pension deficit. If it does, I’ll include the pension deficit in the company’s total debts and recalculate its Debt Ratio.
As an additional sanity check, I also look at the overall size of the pension liabilities. I’ll do this even if there is no pension deficit because although a pension scheme may be in surplus today, it might not be tomorrow, and the potential size of a future deficit will be directly related to the overall size of the scheme’s liabilities.
More specifically, I compare a company's pension liabilities to its ten-year average earnings, and I call this the Pension Ratio.
- Pension Ratio = pension liabilities / average earnings
Here's how I classify the Pension Ratio:
- Good = Below 8
- Okay = Between 8 and 10
- Bad = Above 10
Again, at the very least I want to avoid companies with bad (excessive) pension liabilities, so I use the following rule of thumb:
- Rule of thumb: Only invest if the Pension Ratio is below 10
Next has a small defined benefit pension scheme that doesn’t have a deficit, so it doesn’t make for a very interesting example. Instead, I’ll use BT as an example because the BT pension plan is extremely large.
BT has a supermassive “pension black hole”
BT, as you probably know, is one of the UK’s leading telecom companies, and for most of its history, it was a state-owned monopoly. State-owned entities often give their employees defined benefit pensions, and that is the case with BT, which has a pension plan with around 270,000 members.
BT has a pension deficit of £2.5 billion compared to its ten-year average earnings of £1.9 billion, so the deficit will have a noticeable impact on the company’s Debt Ratio, which is already very high.
More specifically, BT has borrowings of £18.5 billion and lease liabilities of £0.5 billion, giving the company a total debt mountain of £23.9 billion. With average earnings of less than £2 billion, that gives BT a sky-high Debt Ratio of 12.6, and we haven't even included the pension deficit yet.
If we include the pension deficit, then BT’s total debts balloon to £26.4 billion and its Debt Ratio reaches 13.9, which is many times higher than my limit of six.
But perhaps this is an anomaly, where last year’s exceptionally high debts don’t reflect the long-run trend?
Sadly that isn't the case, as BT (unlike Next) has seen its revenues and earnings fall over the last decade while its debts have grown.

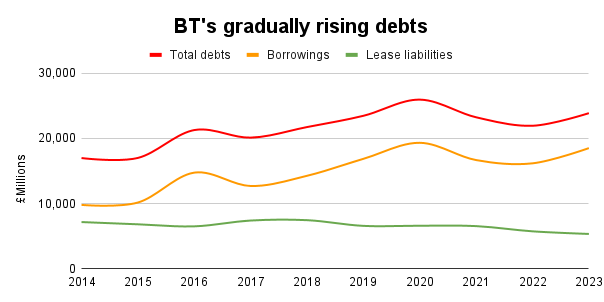
This has, of course, produced a high and rising Debt Ratio.
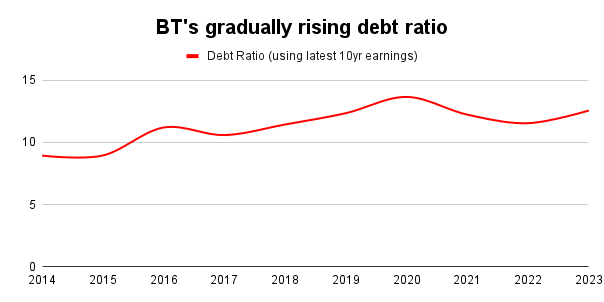
So, in addition to having too much debt, there has been an upward trend in BT’s indebtedness over the last decade, and that may not bode well for the future.
As for the BT pension plan's overall liabilities, they stood at £42 billion in March 2023. That gives BT a Pension Ratio of 22, which is more than double my limit of ten.
Amazingly enough, that is actually a marked improvement from the previous year, where BT’s pension liabilities stood at an astonishing £54 billion, or almost 29 times its average earnings (and three times my limit).
With such an enormous pension scheme, there is a serious risk that BT will have to inject vast amounts of cash into it to make good on its pension obligations, and this is already happening.
For example, in recent years, BT has funnelled about half of its earnings (about £1 billion per year) into its pension scheme to reduce the deficit, and this level of funding is expected to continue for another ten years or so.
This means that BT’s primary purpose is to generate cash for its pension members rather than its shareholders, which perhaps explains why the dividend of this supposedly defensive business was suspended in 2020 and why it has yet to return to anything like its pre-pandemic high.
Summary: Beware of excessive debts and pension liabilities
In summary, the main forms of debt are borrowings, lease liabilities and pension deficits. These are sources of funding that can act like rocket fuel, dramatically speeding up a company’s ascent, but rockets sometimes explode, and that’s also true of companies that use too much debt.
Although excessive debt is a serious problem, a debt-free balance sheet isn’t optimal either. Instead, most high-quality companies operate in the sweet spot between too much debt and too little, and in my experience, that sweet spot is usually covered by these rules of thumb:
- Rule of thumb: Only invest if the Debt Ratio is below 6
- Rule of thumb: Only invest if the Pension Ratio is below 10
No time for spreadsheets or annual reports?
If you like this article but don’t have hours each month to dig through company accounts, you might find my monthly investment newsletter useful.
Once a month I send out a plain‑English PDF showing:
- The full UK dividend stocks model portfolio
- Which shares I’m buying, selling, trimming or topping up
- The latest news and trading updates for each holding
- Where we are in the stock market valuation cycle
All designed so a UK investor can stay on top of their dividend portfolio in well under an hour a month.
Get the latest blog posts & a free checklist
Get my latest articles in (at most) one email per week and download my dividend investing checklist. Topics usually include:
- Detailed reviews of high-quality UK dividend stocks
- Updates on my UK dividend stocks portfolio
- FTSE 100 and FTSE 250 valuations
- "How to" articles covering all aspects of dividend investing
No spam. Unsubscribe anytime.