
This blog post is part of a series where I take a detailed look at my dividend investing strategy.
The last post covered how to identify stocks with high-quality dividend growth, so today I want to talk about profitability, which is a good indicator of a company's quality and a key driver of dividend growth.
More specifically, I’ll cover return on equity, return on capital and profit margins, and then apply two of those metrics to one of the holdings in the UK Dividend Stocks Portfolio.
Table of contents
- Why return on equity is the most important profitability ratio
- Higher returns on equity enable higher dividend growth
- Why I don’t use return on equity to measure profitability
- Net return on capital as an alternative to return on equity
- Taking account of lease liabilities
- How net return on capital relates to competitive strength
- Using profit margin as a supporting indicator of quality
- Measuring Next’s profitability and competitive strength
- Consistently high profitability is a sign of enduring competitive strength
Why return on equity is the most important profitability ratio
Profitability is a measure of how much profit a company generates relative to various inputs such as revenues, assets or employees. This broad description gives us a multitude of profitability ratios, including profit margin (profit as a percentage of revenue), return on assets (profit as a percentage of assets) and return on equity (profit as a percentage of shareholder equity).
In my opinion, return on equity is the foundational profitability ratio because it measures the return shareholders have received on the equity they have invested in a business. Profit per employee or profit per store may be important operating metrics for a company's management, but as a shareholder, return on shareholder equity is what really matters.
In a previous post, I wrote about the similarities and differences between savings accounts and dividend stocks, and this is one area where the two are similar.
For example, if you put £1 million into a savings account with a 5% interest rate, at the end of the year, you’ll receive £50,000 in interest. You can then either reinvest that interest back into the account to benefit from the magic of compounding, or you can spend it as you wish.
Alternatively, if you put £1 million of equity into a new startup business which then produces a 5% return on equity, at the end of the year, your company will earn a £50,000 profit. You can then either reinvest that profit back into your business to benefit from the magic of compounding, or you can withdraw the profit as a dividend to spend as you wish.
In both cases, you put some money in, and then you get a certain return that you can either reinvest or spend. In this sense, return on equity is effectively the interest rate that shareholders get on their equity.
Higher returns on equity enable higher dividend growth
The Rule of 72 tells us we can estimate the time required to double our money in a savings account by dividing the number 72 by the account’s interest rate.
If you put money into a savings account with an interest rate of 7.2% and then reinvest all the interest, the Rule of 72 tells us that your savings will double in approximately ten years. Perhaps more realistically, if you put money into a savings account with an interest rate of 1% and reinvest all the interest, the Rule of 72 tells us that it will take 72 years to double your money.
The same principle applies to companies and their return on equity.
If a company generates a return on equity of 7.2% and reinvests all its earnings, the company will (ignoring the complexities of real life) double its equity in approximately ten years. Given that the company's return on equity has remained fixed at 7.2%, a doubling of shareholder equity would also lead to a doubling of earnings.
If another company has a higher return on equity of 10% and if that company retains all its earnings, it will approximately double its equity and, therefore, its earnings in just 7.2 years (again, ignoring the complexities of real life).
In other words, the higher a company’s return on equity, the faster it can grow by reinvesting its earnings. This is important reinvesting earnings is almost always the least risky and most sustainable way to grow a business over the long term, and sustainable long-term dividend growth is what I'm looking for.
Here’s one last example showing how return on equity drives long-term dividend growth.
In this example, we have a company that generates a return on equity of 20%. That's a very high return which would fund a growth rate of 20% per year if all earnings were reinvested. However, the company is very large within its industry, and a 20% growth rate is unrealistic, so it only reinvests half its earnings while paying the other half out as dividends (giving the company a dividend cover ratio of 2.0). With half of its 20% returns reinvested each year, the company can grow its shareholder equity at the more realistic rate of 10% per year.
The Rule of 72 says that a 10% growth rate will lead to a doubling of equity in 7.2 years, and as return on equity and dividend cover remain constant in this example, the company's earnings and dividends will also double in 7.2 years.
This is exactly the process I described in the previous post on high-quality dividend growth. In other words, return on equity is the engine that drives the flywheel of dividend growth, and the more powerful that engine is, the faster the flywheel can spin.

The Dividend Flywheel:
- Shareholder equity: Funding provided by shareholders, mostly in the form of retained earnings that are invested into new assets to drive growth.
- Revenues: Customers pay money into the business when they purchase products and services generated by the company’s assets.
- Earnings: After all expenses have been deducted from revenues, shareholders are hopefully left with a handsome profit.
- Retained earnings and dividends: Companies retain some or all of their earnings to provide additional shareholder funding for growth and expansion. Earnings not retained are paid to shareholders as dividends and share buybacks.
Why I don’t use return on equity to measure profitability
Having just spent the last few minutes telling you that return on equity is the foundational measure of profitability, you may be surprised (and perhaps annoyed) to hear that I don’t use it to analyse companies. The reason is that return on equity has a serious flaw.
To illustrate this flaw, I’ll use the example of a widget manufacturer with £1 million of shareholder equity invested in a single factory. The company has no debt and produces a profit of £100,000, which is a return on equity of 10%.
The CEO wants to grow the business fast to dominate its niche, so the company borrows £5 million at an interest rate of 5% (giving an annual interest bill of £250,000) to build five additional factories.
The company now has six factories, and the balance sheet says it has £6 million of assets, funded by £5 million of debt and £1 million of shareholder equity.
The new factories are just as profitable as the first, so each factory makes a profit (before interest payments) of £100,000, or £600,000 in total. After paying debt interest of £250,000, the company is left with a profit of £350,000.
A £350,000 profit from £1 million of equity is a return on equity of 35%. In other words, taking on £5 million of debt has increased the company’s return on equity from 10% to 35%, making the company more than three times as profitable.
That sounds great, and many companies do go down this route of using more and more debt to boost their returns on shareholder equity to higher and higher levels. After all, what shareholder wouldn’t want higher returns on their equity?
But debt isn’t a free lunch. In most cases, debt interest is a fixed cost, whereas revenues aren't fixed, and this combination makes indebted companies riskier and more fragile during downturns.
For example, let’s say there’s a recession and the profit from each factory falls by 60%, from £100,000 to £40,000. If the company had no debt, its total profits would also fall by 60%, which is a big decline, but at least the company would still be profitable. However, with £5 million of debt, that is no longer the case.
If each factory's profit fell by 60%, from £100,000 to £40,000, the six factories would produce a combined £240,000 profit before interest payments. The company's interest expense is £250,000, so after deducting interest, the company would make a profit of minus £10,000; in other words, a loss. This means that a 60% decline in profit before interest has been turned into a more than 100% decline in profit after interest, so the company's profits are now much more sensitive to economic downturns than they would be if it carried little or no debt.
In a worst-case scenario, if the company was unable to pay the interest on its debts, the bank could seize control to sell off the company's assets to repay the loan. The company might survive this trauma, but shareholder equity would very probably be wiped out, and the value of the company's shares would almost certainly go to zero.
So, the flaw with return on equity is that it doesn’t reflect the inevitable risks that come with debt. As companies take on more debt and become riskier, their returns on equity will typically go up, and I don’t want to use a ratio that looks more and more positive as a company takes on more debt and more risk.
To get around this flaw, I use an alternative ratio that takes account of the negative impact of debt and interest.
Net return on capital as an alternative to return on equity
Net return on capital is very similar to return on equity, but instead of comparing profit to equity, it compares profit to capital (which is the sum of both equity and debt), and this makes a big difference in how the ratio responds to increasing debts.
In the previous example, the company initially had no debt and no debt interest to pay, so equity and capital were both £1 million, and return on equity and net return on capital were also the same, at 10%.
When the company took on £5 million of debt, that led to an increase in debt and, therefore, an increase in capital, with capital going from £1 million to £6 million. The company’s profit also increased from £100,000 to £350,000.
This led to an increase in return on equity, from 10% to 35% (£350,000 profit from £1 million of equity), which made the company look more attractive even though it was much riskier than before.
In contrast, a £350,000 profit from £6 million of capital is a net return on capital of 5.8%, which is significantly less than the 10% return on capital achieved when the company had no debt.
So, unlike return on equity, which increases when a company takes on debt, net return on capital will always decrease when a company takes on debt, reflecting the added risk that inevitably comes with debt-funded growth.
Note: You may have noticed that I call this ratio "net" return on capital rather than just return on capital. The reason is that the standard return on capital ratio uses profit before interest is deducted. I specifically use net profit (i.e. profit after deducting interest) because I want the ratio to be negatively impacted by the company's debt interest payments.
Taking account of lease liabilities
So far, I’ve talked about debt in terms of loans from a bank, but this ignores lease liabilities, which are another common form of debt.
Why are lease liabilities a form of debt? Well, let’s say a company borrows some money to buy a shop. On its balance sheet, the company will have an asset (the shop) and a liability (the debt owed to the bank), and it will have to make fixed loan repayments every month for, say, the next 20 years.
What if the company leased the shop instead of buying it? In that case, the balance sheet would still have an asset (a “right of use” asset) and a liability (a lease liability that is equal to the sum of all the contractually obligated future lease payments) on its balance sheet, and it would have to make fixed rent payments every month for, say, the next 20 years.
In terms of the impact on the company’s balance sheet and profit, there is little material difference between signing a loan contract and a lease contract. On that basis, leases really should be treated as a form of debt, where a company is effectively borrowing a store or a factory from the landlord.
If we include lease liabilities as another form of capital, we get the final version of the net return on capital ratio:
- Net return on capital: Profit as a percentage of capital (equity + borrowings + lease liabilities)
How net return on capital (net ROC) relates to competitive strength
I’m looking for companies that are very likely to grow their equity, revenues, earnings and dividends for decades to come, and for that, they need some sort of enduring competitive advantage.
Fortunately, net return on capital just happens to be a useful tool for identifying those companies. To understand why, we need to step back and look at the big picture.
Capitalism is a system for allocating a society’s capital (its resources such as land, raw materials, tools and people) to activities that most efficiently and effectively satisfy the wants and needs of its citizens. It does this by leveraging the profit-seeking (or, at the very least, self-interested) tendencies that most people have.
For example, imagine a company that invents a fantastic widget that lots of people want to buy. In other words, there is a lot of demand. Supply, on the other hand, is limited because the company only has one factory. If demand exceeds supply by a factor of five, the company can generate an abnormally high return on capital by selling widgets to the richest 20% of customers at a high price that they will just about accept.
If other profit-seeking capitalists see those abnormally high returns, they will begin to direct their capital (cash, manufacturing facilities, people, etc.) towards manufacturing their version of the widget. As capital flows into this market, seeking high returns, the supply of widgets will increase. If supply doubles, prices will need to drop so that the richest 40% of potential customers can afford to buy the widget.
As long as the return on capital from selling these widgets remains above average, they will attract more capital, more competition and more supply. This will continue until prices have been driven down to the point where net returns on capital are no better than the average that is available across a wide array of markets. At that point, there will be no strong incentive for fresh capital to enter the widget market, so the flood of new capital and competitors will dry up.
Sometimes, too much capital flows into a market, creating too much supply. When that happens, prices may fall even further in an attempt to widen the pool of customers. However, at some point, excessive supply will lead to excessively low prices and returns on capital, and when that happens, capital will begin to exit the market as it seeks higher returns elsewhere.
This endless process of moving capital to wherever it can earn the highest return is how capitalism tries to allocate the right amount of capital to supply the right amount of goods and services to meet society's multifarious wants, needs and demands.
What does any of that have to do with enduring competitive advantages and companies that can grow their dividends for decades?
The answer is.. everything.
If a company provides products or services that generate high net returns on capital, it will soon face an increase in competition and an increase in supply that drives down prices until net returns on capital are mediocre at best. It should, therefore, only be possible for companies to produce high net returns on capital for relatively short periods, perhaps a handful of years at most.
This is, in fact, exactly what happens in most cases, but a small minority of companies can produce high returns on capital while fending off hordes of competitors, not just for a handful of years but for decades and, in rare cases, centuries. And companies can only do that if they have enduring competitive advantages.
This matters, not just because higher returns on capital can fuel higher sustainable growth rates, but also because these companies are much more likely to still exist in a few decades.
Don’t forget that capitalism is an endless battle for survival. Companies that generate consistently low returns on capital are competitively weak, and they typically get killed off pretty quickly. Companies that generate consistently mediocre returns on capital are competitively mediocre, and they may survive for a few decades if they’re lucky. However, companies that generate consistently high returns on capital have enduring competitive strengths, and this is precisely what allows them to survive and thrive for many decades.
To take account of the importance of sustained high returns, I always measure net returns on capital over a decade, which I think is the minimum needed to gain any insight into the durability of a company’s competitiveness.
And, as with my other metrics, I use good, okay and bad ranges to help me decide if I'm looking at a good, okay or bad company. Here's how I classify the ten-year average net return on capital:
- Good = Above 10%
- Okay = Between 7% and 10%
- Bad = Below 7%
At the very least, I want to avoid companies that consistently produce bad returns on capital, so I use the following rule of thumb:
- Rule of thumb: Only invest if the ten-year average net ROC is above 7%
- Rule of thumb: Only invest if net ROC was above 7% in at least seven of the last ten years
To create a single profitability ratio, I multiply ROC's average by its consistency, which better highlights companies that have consistently produced good returns on capital. I call this ratio ROC Quality and I classify it in the same way as ROC:
- Good = Above 10%
- Okay = Between 7% and 10%
- Bad = Below 7%
And I apply the same rule of thumb to avoid companies with consistently bad returns on capital:
- Rule of thumb: Only invest if ROC Quality is above 7%
Using profit margin as a supporting indicator of quality
Although I think that return on equity is the foundational profitability ratio and net return on capital is effectively a debt-adjusted version of return on equity, other profitability ratios can still be useful.
Profit margin is perhaps the best-known profitability metric, and although profit margins vary widely from industry to industry, I still think it’s a useful supplementary ratio.
Profit margin is the ratio of profit to revenues, expressed as a percentage, so if a supermarket sells a tin of beans for £1 and makes a profit of 1p, its profit margin on that tin is 1%. This effectively tells you how much value a company adds to the products or services it provides.
Using a tin of beans as an example again, if a supermarket makes a 1p profit on a £1 tin of beans, it must have had expenses of 99p, so 99% of the value of the tin was provided by resources that are "outside" the company (the bean farmer, the tin manufacturer, electricity suppliers and even the company’s employees). What the company provides is the specific way these resources are brought together and organised, and in this example, the specific organisation and behaviour of the company added a mere 1% of value to that tin of beans.
As I’ve already said, profit margins do vary widely by industry. For example, supermarkets typically have margins of around 3%, whereas investment platforms often have profit margins of 30% or more. This doesn’t mean investment platforms are "better" businesses than supermarkets or that the market for investment platforms is less competitive, it just means they’re different.
When I look at profit margins, I’m mostly looking to avoid companies with very low margins. If a company makes a profit margin of 1%, then it doesn’t take much to wipe those profits out. If there’s a sudden rise in energy prices or wages or a significant decline in demand and revenues, low-margin companies are at serious risk of turning profits into losses, and losses are generally not conducive to safe, reliable dividends.
As with net returns on capital, I measure profit margins over ten years and classify them as follows:
- Good = Above 10%
- Okay = Between 5% and 10%
- Bad = Below 5%
The related rule of thumb excludes me from buying stocks with consistently bad profit margins:
- Rule of thumb: Only invest if the ten-year average profit margin is above 5%
- Rule of thumb: Only invest if profit margins were above 5% in at least seven of the last ten years
Consistently high profit margins aren't necessarily a sign of competitive strength and durable competitive advantages, so I don't combine the profit margin average and consistency into a Margin Quality score.
Measuring Next’s profitability and competitive strength
Next is one of the UK’s leading clothing and homewares retailers, and it has been in the UK Dividend Stocks Portfolio since 2016. Here’s a snapshot of the company’s performance over the last decade.

Data source: SharePad
Note: Next didn’t pay any dividends in late 2020 and 2021 because of the pandemic. However, in 2022 it paid large special dividends that were effectively deferred dividends from 2020 and 2021, so the chart shows those dividends as having been paid in 2020 and 2021.
Using the dividend growth metrics described in the previous post, Next’s Growth Rate is 9% and its Growth Quality is 69%, and I would classify those as good and okay, respectively.
To calculate net return on capital, we need figures for profit, equity, borrowings and lease liabilities, and these can be found on the income statement and balance sheet.
To calculate profit margin, we need profit and revenue, both of which can be found on the income statement.
Here’s a quick reminder of how to calculate these ratios:
- Net return on capital = profit / (equity + borrowings + lease liabilities) * 100%
- profit margin = profit / revenue * 100%

Data source: SharePad
As you can see from the chart, Next’s profitability has been extremely consistent, with very little variation from one year to the next.
Average net returns on capital over the last ten years came to 19%, which I would classify as good. In fact, Next's net return on capital only fell below 10% once, which was during the pandemic.
Profit margins were also strong, averaging 14% over the last ten years, which I would also classify as good. Those profit margins were also consistently strong, remaining above 5% every single year.
Based on Next's impressively consistent track record of inflation-beating growth and an even more impressive track record of consistently strong profitability, I would say that Next has many of the hallmarks of a good quality business.
Special case: Pass-thru revenues
Some companies have pass-thru revenues that can leave them with misleadingly low profit margins. This is because pass-thru revenues are (as the name suggests) passed directly from the customer to the main supplier, with the company making little or no margin on those revenues. Two common examples are recruitment firms and "hands-off" distributors.
Recruitment firms: When recruitment firms like Robert Walters are asked to find a new employee for a client, they will often use advertising to attract candidates. The client company pays for that advertising, and the recruitment firm passes those revenues on to the advertising firm and only charges a very small margin because the advertiser, rather than the recruitment firm, is doing most of the work.
Also, when recruitment firms place temporary candidates into a role, the client will typically pay the temp's wages to the recruitment firm, which are then passed through to the temp. Again, only a small margin is charged for this.
Because of this, recruitment firms often have very low margins of 5% or less, but this doesn't reflect the true picture because it includes pass-thru revenues where very little value is being added, so very little margin is being charged.
You can easily exclude those pass-thru revenues by measuring net fee margin instead of profit margin, which compares (net) profit to gross profit rather than revenues (gross profit excludes all pass-thru revenues):
- Net fee margin = profit / gross profit * 100%
Hands-off distributors: These are companies that acquire customers for other companies. Once the customer is acquired, they don't actually supply the underlying product or service, so their margins are very thin. A good example is Telecom Plus, which operates as Utility Warehouse.
Telecom Plus supplies customers with gas, electricity, mobile, broadband and other utility services, but it doesn't actually provide the underlying gas, electricity or telecoms service. Those are provided by third parties like e.on and Talk Talk, so Telecom Plus is a hands-off intermediary that focuses purely on customer acquisition and customer service (customers receive bills from Utility Warehouse rather than the actual supplier).
Customers pay Telecom Plus their utility bills, but of course, almost all of that revenue is passed through to the underlying supplier. This gives Telecom Plus very low margins, but they're misleadingly low because a significant portion of those revenues has nothing to do with the service Telecom Plus is providing to suppliers (customer acquisition and customer service).
As with recruitment firms, we can strip out these pass-thru revenues by comparing profit to gross profit, as gross profit excludes the cost of goods sold (in this case, the cost of the electricity and other utilities that are passed onto the underlying supplier).
- Profit margin net of COGS (cost of goods sold) = profit / gross profit * 100%
Deciding whether these adjustments are or aren't appropriate isn't always obvious, so you could simply apply the default rule of thumb and exclude any company where average profit margins are consistently in the "bad" range. That would exclude most recruitment firms and distributors, but that shouldn't be a problem as there are plenty of other higher-margin fish in the sea.
Consistently high profitability is a sign of enduring competitive strength
In conclusion, I’m a long-term investor looking for companies that can grow their dividends for many years and perhaps many decades to come. Only the strongest companies can survive and thrive over that sort of timeframe, and those companies have durable competitive advantages that leave a trail of clues in their wake. One of the clearest and easiest-to-spot clues is a long track record of consistently high net returns on capital, supported by suitably fat profit margins.
Here are my rules of thumb one last time (and remember, these are bare minimum standards):
- Rule of thumb: Only invest if the ten-year average net ROC is above 7%
- Rule of thumb: Only invest if net ROC was above 7% in at least seven of the last ten years
- Rule of thumb: Only invest if ROC Quality is above 7%
- Rule of thumb: Only invest if the ten-year average profit margin is above 5%
- Rule of thumb: Only invest if profit margins were above 5% in at least seven of the last ten years
The next post in this series looks at how to avoid dividend traps with excessive debts.
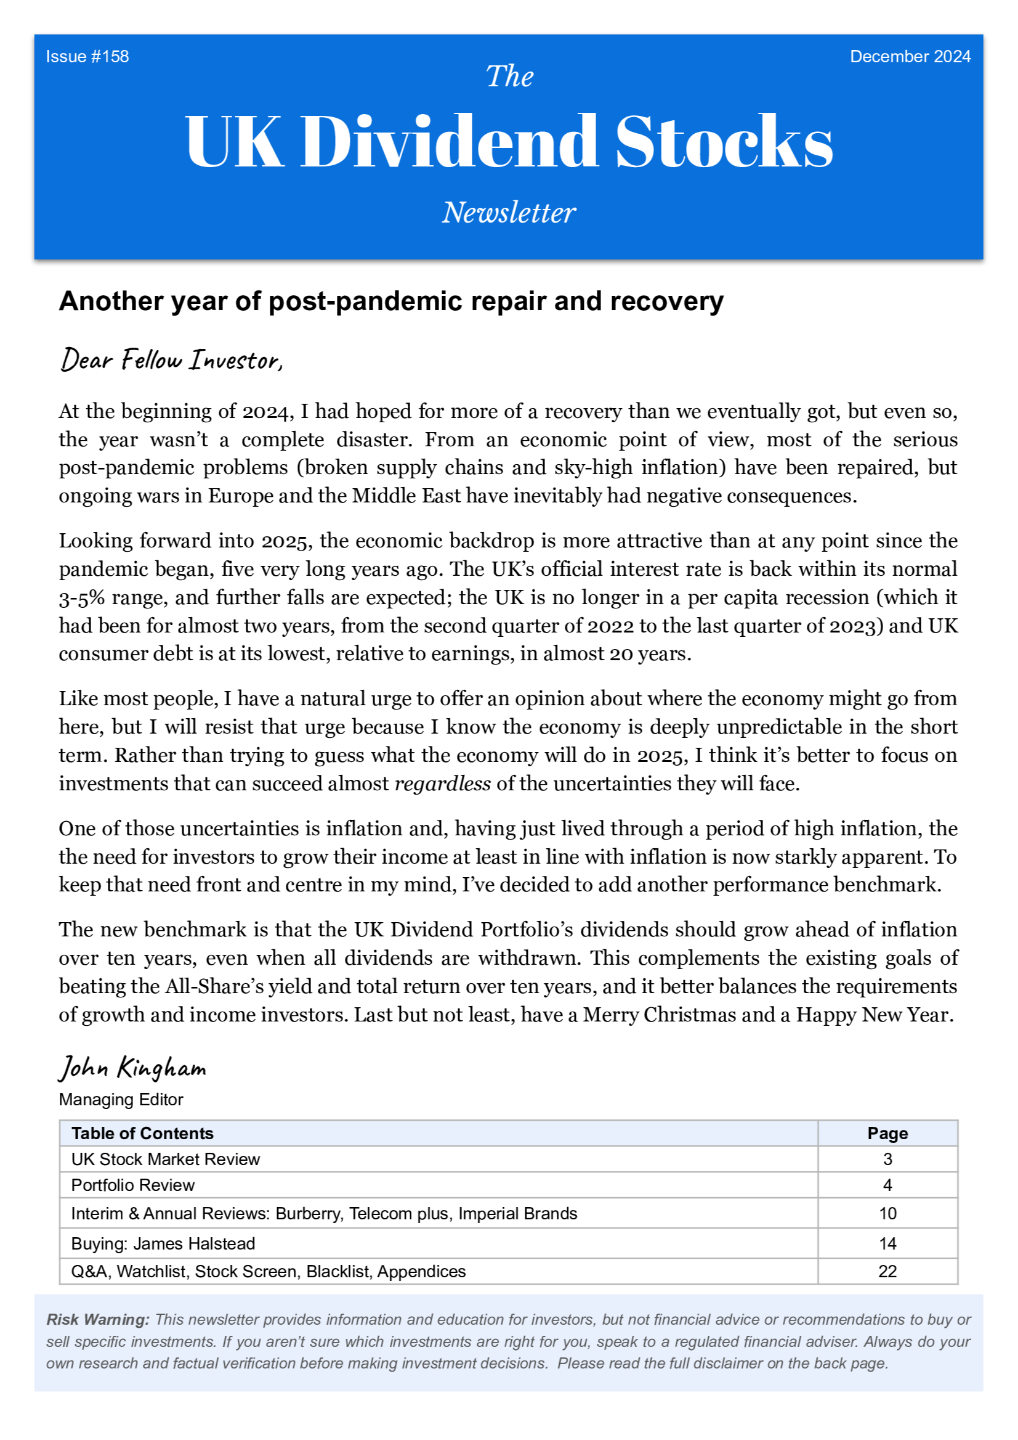
No time for spreadsheets or annual reports?
If you like this article but don’t have hours each month to dig through company accounts, you might find my monthly investment newsletter useful.
Once a month I send out a plain‑English PDF showing:
- The full UK dividend stocks model portfolio
- Which shares I’m buying, selling, trimming or topping up
- The latest news and trading updates for each holding
- Where we are in the stock market valuation cycle
All designed so a UK investor can stay on top of their dividend portfolio in well under an hour a month.
Get the latest blog posts & a free checklist
Get my latest articles in (at most) one email per week and download my dividend investing checklist. Topics usually include:
- Detailed reviews of high-quality UK dividend stocks
- Updates on my UK dividend stocks portfolio
- FTSE 100 and FTSE 250 valuations
- "How to" articles covering all aspects of dividend investing
No spam. Unsubscribe anytime.