In 2025, the FTSE 100 went up by 20% and over the last two years it’s up by more than 35%.
Such rapid gains are somewhat out of character, as the FTSE 100 is generally seen as a low-growth index full of corporate dinosaurs, but the facts are what they are.
As a UK investor, I’m happy to see our primary index having its moment in the spotlight, but rapid price gains can also have a dark side. When they go on for too long, they can leave an individual stock or an entire index overvalued and with serious risks of a major price decline.
Does that apply to the FTSE 100 now that it's broken through the 10,000 barrier? I think the answer is no, and here’s why.
Valuing the FTSE 100 using its CAPE ratio, not its price
Ultimately, it doesn't matter whether the FTSE 100's price has gone up or down a lot over the last two years. What matters is how its price compares to its earnings, and for that, my go-to metric is the CAPE ratio, or cyclically adjusted price/earnings ratio.
The CAPE ratio is essentially the same as the standard PE ratio, but it compares the index's price to its ten-year average inflation-adjusted earnings, rather than its earnings over the last year. This smooths out the ups and downs of good and bad years, where one-year earnings can be abnormally high or low, leaving us with a much more stable earnings figure and a much more reliable valuation ratio.
Below is a chart showing the FTSE 100’s annual earnings, cyclically adjusted earnings and dividends over almost 40 years. Hopefully this makes it clear that cyclically adjusted earnings are a stable and reliable indicator of the index’s long-term progress, as are its dividends.
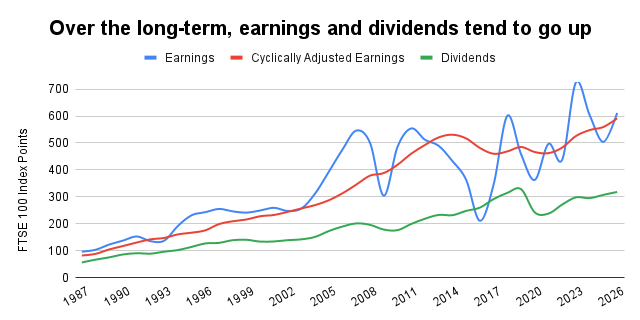
The big takeaway from this chart is while the FTSE 100’s earnings and price may go up and down in the short-term, its cyclically adjusted earnings and dividends tend to go up in a much more sedate and steady fashion. And because its average earnings and dividends tend to go up over time, the FTSE 100’s fair value (which is different to its market price) also tends to go up over time.
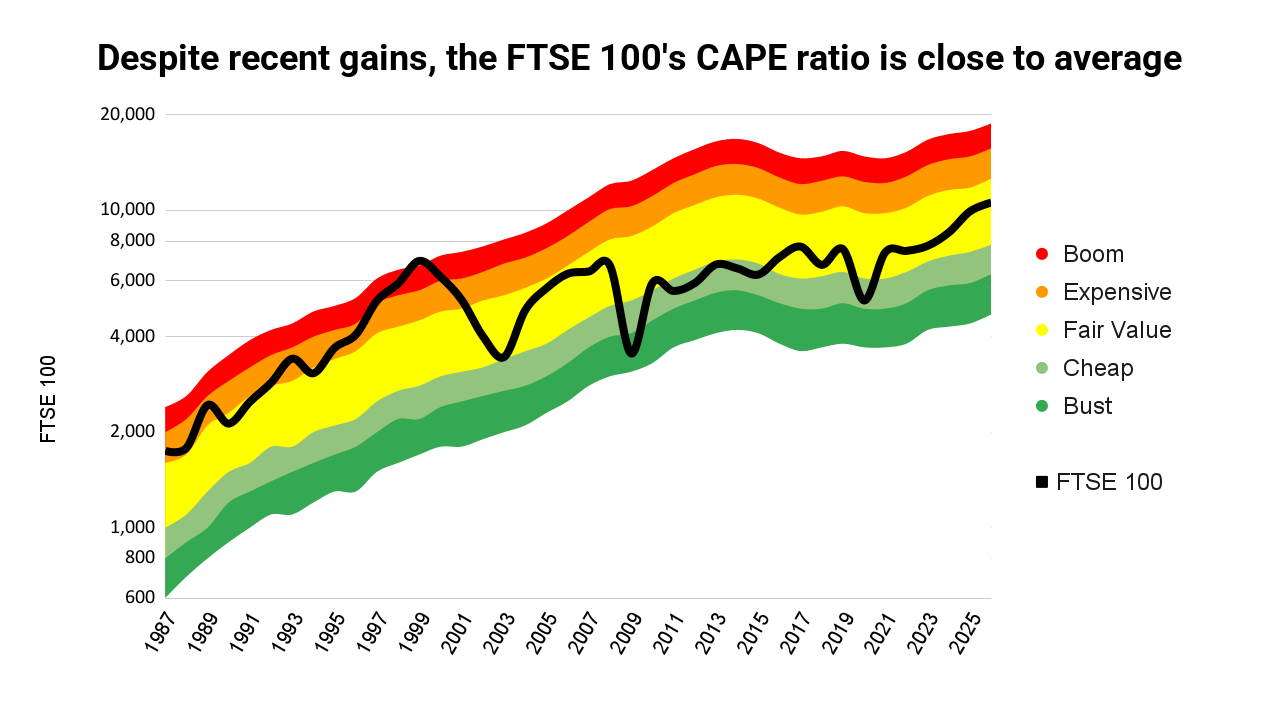
The FTSE 100’s CAPE ratio says the index is (slightly) overvalued
Here’s another chart, this time showing the CAPE ratio and how it’s changed over almost 40 years.
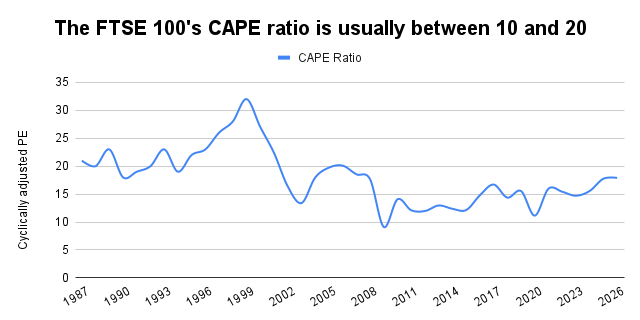
The most important thing to note here is that the CAPE ratio doesn’t go down to zero, and it doesn’t go up to infinity. Instead, it stays within a fairly narrow range, going as high as 32 during the 1990’s dot-com bubble and as low as 9 during the depths of the credit crunch. In fact, over the last 20 years it's stayed within an extremely narrow range of about 10 to 20.
This is as it should be, because PE ratios are driven by optimism and pessimism, and optimism and pessimism have limits. For example, until recently, investors were willing to pay about 300-times Tesla’s earnings to buy its shares, which is extraordinarily optimistic. But optimism has its limits, and even those investors weren’t willing to pay a PE ratio of one million.
Unlike Tesla shareholders, FTSE 100 investors are not known for their rampant optimism, so the FTSE 100’s CAPE ratio has stayed fairly close to 15 over the last 20 years, although the longer-term average is closer to 16.
That average figure is useful because it tells us what investors have been willing to pay when their optimism and pessimism are neither extremely high nor low. That makes the long-term average CAPE ratio a good proxy for fair value, and it has a long history of correctly identifying both overvalued and undervalued markets.
At the time of writing, the FTSE 100 sits at 10,583 with a CAPE ratio of 17.9 and a long-term average CAPE ratio of 15.9. This tells us that the index’s CAPE-based fair value is currently 9,413, which is clearly below the current price. That means the FTSE 100 is currently trading above fair value, or about 12% above fair value to be precise.
But don’t panic. In the grand scheme of things, a 12% overvaluation is essentially nothing, and the index would have to go a lot higher than than that to be considered lukewarm, let alone hot (and it is certainly nowhere near bubble territory).
A “hot” FTSE 100 would have to be north of 16,000
Fortunately, we have decades of history to help us understand what a truly expensive FTSE 100 looks like. Exhibit A is the dot-com bubble from the late 1990s, where investors thought tech stocks would keep going up at 20% per year forever.
Back in 1999, when the Spice Girls and Burberry baseball caps were still cool, the FTSE 100’s CAPE reached 32, which is about double its long-run average. In contrast, during the depths of the 2009 financial crisis, CAPE fell as low as 9, which is little more than half its long-term average.
This range of around half to double the long-term average is a recurring theme for CAPE, as similar ranges show up for the FTSE 250 and S&P 500. In each case, the range is probably limited by deep-seated limits to human nature, where the crowd can only become about twice as optimistic as usual, or about twice as pessimistic as usual (although there are rare cases in other markets where the madness of crowds has gone far beyond these limits).
Whatever the root cause, this range gives us a useful way to look at where the FTSE 100 have been in the past, or would be today, if optimism or pessimism were at their historical extremes.
The chart below shows this range of possible values as a rainbow, extending from depression valuations (in green, as low prices are good for future returns) to bubble valuations (in red, as high prices are bad for future returns).
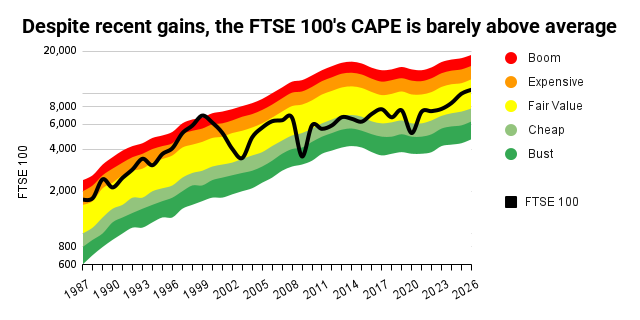
For example, the dot-com bubble reached its peak in late 1999, and you can see it on the chart where the FTSE 100 (the black line) goes into the red danger zone through 1998-2000. On the flip-side, the index bottomed out during the existential threat of the 2009 financial crisis, and the resulting ultra-low valuations show up as the index entering the dark green zone in the early part of that year.
The central yellow band is the fair value range, as it’s unrealistically precise to say that fair value is a single figure (like the 9,400 I mentioned previously). Instead, the future is always somewhat opaque, and a fair value range makes that more explicit.
The fair value range currently stretches from 7,800 to 12,600, so as long as the FTSE 100 sits somewhere in that range (as it currently does) I am reasonably confident saying it’s close to fair value.
For the index to be slightly expensive (the orange band in the CAPE rainbow), it would have to rise above 12,600. I don’t think it’s likely to go that high in 2026, although it seems like a realistic possibility for 2027.
To reach seriously over-optimistic levels (the red zone), the FTSE 100 would need to exceed 15,700, or 16,000 if you’re wary of false precision. That really does seem like a near impossibility, at least in the next few years, unless investors start to believe that Dear Old Blighty is the best place to invest on Earth (which would require a huge change in sentiment).
And if you really want to go crazy, the FTSE 100 won’t reach true bubble levels until it gets close to 19,000, at which point it would be as insanely expensive as it was at the zenith of the dot-com bubble. I will not be holding my breath while we wait for that price target.
My FTSE 100 forecast for 2026
As a grumpy old quant, I tend to let the numbers do the talking. In this case, that means my forecast is based on the (obviously incorrect) assumption that the FTSE 100 ends the year precisely at fair value.
Given that fair value is currently 9,400, that means my base-case assumption is that the index will fall by 11% over the rest of the year, which is well within the normal range of ups and downs.
On the plus side, a lower price would increase the index’s dividend yield and expected future returns, and that would be a welcome piece of good news.
No time for spreadsheets or annual reports?
If you like this article but don’t have hours each month to dig through company accounts, you might find my monthly investment newsletter useful.
Once a month I send out a plain‑English PDF showing:
- The full UK dividend stocks model portfolio
- Which shares I’m buying, selling, trimming or topping up
- The latest news and trading updates for each holding
- Where we are in the stock market valuation cycle
All designed so a UK investor can stay on top of their dividend portfolio in well under an hour a month.
Get the latest blog posts & a free checklist
Get my latest articles in (at most) one email per week and download my dividend investing checklist. Topics usually include:
- Detailed reviews of high-quality UK dividend stocks
- Updates on my UK dividend stocks portfolio
- FTSE 100 and FTSE 250 valuations
- "How to" articles covering all aspects of dividend investing
No spam. Unsubscribe anytime.