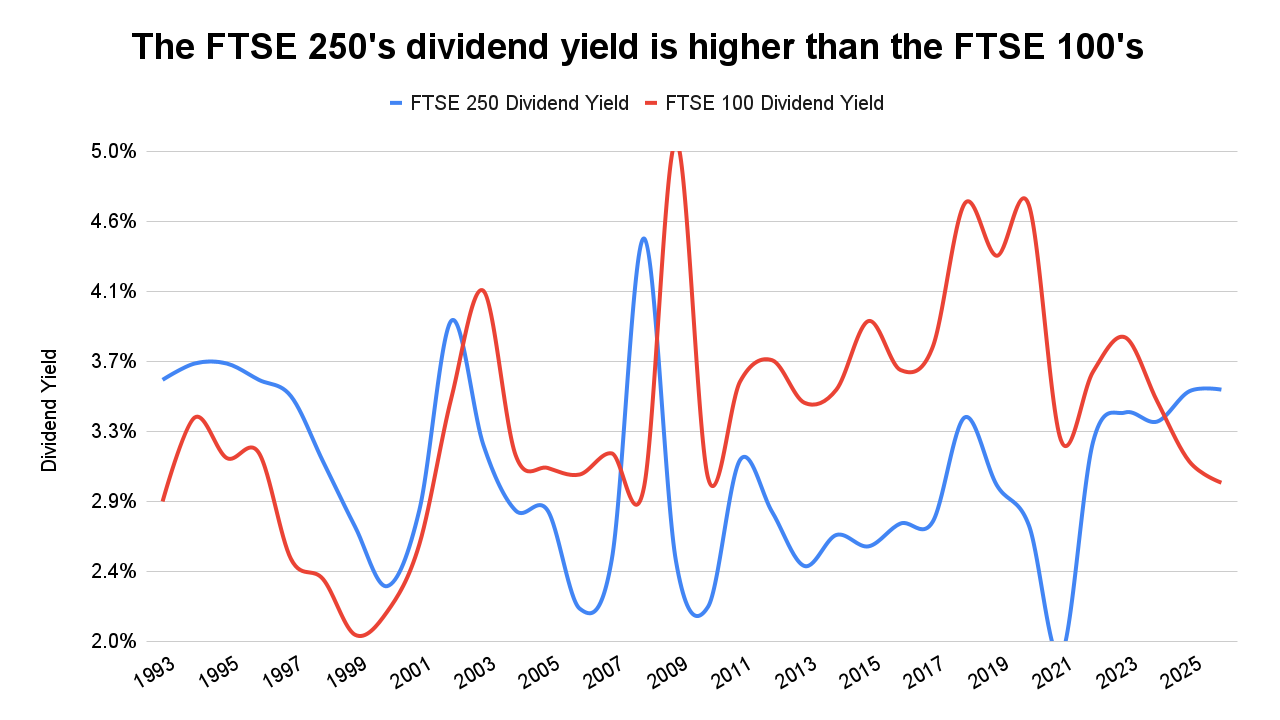
When the world is functioning as it should, the FTSE 250 has a lower dividend yield than the FTSE 100.
That’s because the FTSE 250 is a higher-growth index. As I'm sure you're aware, most of the time investors have to pay up for growth, because the mathematical rules of investing tell us that is how it must be.
And yet today, the FTSE 250 has a higher dividend yield than the FTSE 100, and a lower PE ratio.
So what is going on here? Has the FTSE 250 lost its mojo? Are investors expecting a low-growth future for the FTSE 250, held back by its higher exposure to “Broken Britain”? Or is something else going on?
Historically, the FTSE 250 has grown faster than the FTSE 100
Over the long term, the FTSE 250 has materially outperformed the FTSE 100 in every respect. For example, since 1993 (as far back as my FTSE 250 data goes):
- The FTSE 250’s earnings increased faster than the FTSE 100's, by an average of 7.3% per year, versus 4.6%
- The FTSE 250’s dividend increased faster than the FTSE 100's, by an average of 5.5% per year versus 3.7%
- The FTSE 250’s price increased faster than the FTSE 100's, by an average of 5.5% per year versus 3.5%
On average, the FTSE 250’s earnings, dividends and price have increased about 2% per year faster than the FTSE 100. That is a significant margin of outperformance. And when the FTSE 100 isn’t even growing by 5% per year, and it’s the kind of outperformance that usually commands higher prices, higher PE ratios and lower dividend yields.
Today, the FTSE 250 is still growing faster than the FTSE 100
If the FTSE 250’s higher growth rate was a historical feature that no longer applied, then that might explain its post-pandemic underperformance relative to the FTSE 100, and its unusually low valuation today. But that isn’t the case, as the FTSE 250’s earnings and dividends are still outgrowing the FTSE 100’s.
For example, relative to 2019 (the last normal year before COVID turned the world upside down):
- The FTSE 250’s earnings are up 81%, while the FTSE 100’s are only up 33%
- The FTSE 250’s dividend is up 27%, while the FTSE 100’s has fallen by 3%
- The FTSE 250’s ten-year average inflation adjusted earnings (which smooths out the ups and downs of any one year) are up 13%, while the FTSE 100’s are down 5%
This is no mere coincidence. After all, trees don’t grow to the sky, elephants can’t outrun a cheetah and larger companies generally don’t grow faster than smaller companies. In this regard at least, by outgrowing the large-cap FTSE 100, the mid-cap FTSE 250 is doing what it should be doing.
To get a clearer picture of what this all means, below is a chart showing the FTSE 250’s growth, in terms of its earnings, cyclically adjusted earnings and dividends. If you’re not familiar with the CAPE ratio, cyclically adjusted earnings are just the ten-year average earnings, adjusted for inflation. This is a useful way to smooth out the noisy ups and downs of annual earnings, in order to show the underlying long-term progress of a company or index.
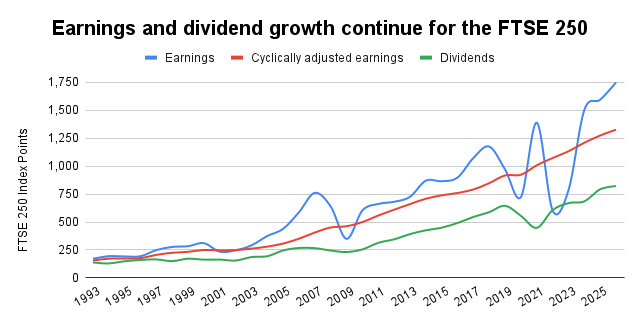
As you can see, the FTSE 250's earnings and dividends were seriously disrupted by the pandemic, but in both cases, they’ve recovered to new highs. The same is not true for the FTSE 100, and you can read more about that in my recent FTSE 100 review.
Historically, the FTSE 250 has been more expensive than the FTSE 100
As a general rule, investors are willing to pay higher multiples to invest in faster-growing companies because they’re willing to get less jam today (in terms of earnings and dividends) in exchange for the expectation of more jam tomorrow (via higher earnings and dividend growth rates).
This is exactly what we see in the historical records of both the FTSE 250 and FTSE 100. For example, since 1993:
- The FTSE 250 has had a higher average PE than the FTSE 100, at 19.6 versus 15.7
- The FTSE 250 has had a lower average dividend yield than the FTSE 100, at 2.9% versus 3.3%
- The FTSE 250 has had a higher average CAPE ratio than the FTSE 100, at 22.3 versus 17.7
Clearly, when judged over the span of several decades, investors are generally a rational bunch. They’re willing to accept a higher PE ratio and a lower dividend yield on an investment that has a long history of higher growth. Less jam today for more jam tomorrow, which is all very sensible.
Today, the FTSE 250 has a lower valuation than the FTSE 100
For one reason or another, that sensibleness has evaporated over the last few years. Since the pandemic struck in early 2020, the FTSE 250’s valuation has gone into decline, while the FTSE 100’s has gone upwards at an increasingly rapid pace.
For example, with the FTSE 250 currently at 23,206 and the FTSE 100 at 10,668:
- The FTSE 250’s PE ratio is lower than the FTSE 100’s, at 13.3 versus 17.4
- The FTSE 250’s dividend yield is higher than the FTSE 100’s, at 3.5% versus 3.0%
- The FTSE 250’s CAPE ratio is lower than the FTSE 100’s, at 17.5 versus 18
The last time we had this kind of valuation reversal was during the 1990s, when the FTSE 100 had a relatively high exposure to the darling tech and telecoms stocks of the day, like Vodafone. The 1990s valuation reversal was caused by rapid price gains for the FTSE 100, and that is also the underlying cause today.
More specifically, since the pandemic struck in late 2019, the FTSE 100 has gone up by more than 40%, while the FTSE 250 has barely gone up at all, with a price increase of less than 5%.
Such a significant difference in price movements will inevitably have a significant impact on valuations, and that is why the FTSE 250 is in the rare position of having a lower PE and a higher yield than the FTSE 100.
Why is the FTSE 250 cheaper than the FTSE 100?
The next question is, why has the FTSE 250’s price performed so badly since the pandemic, relative to the FTSE 100?. The answer, of course, is that nobody really knows, because prices are set by individuals and algorithms whose reasoning we can only guess at.
That is a somewhat unsatisfactory answer, so I’ll throw my hat into the ring by saying that it’s probably some combination of (a) the attractive power of the US tech bubble and (b) the repulsive power of the “Broken Britain” narrative.
Starting with the US tech bubble, for about ten years we’ve lived in a world where there seems to be no alternative to investing in US tech stocks, at least if you want decent capital gains. If you want dividends then that’s a different story, but more and more people are happy to generate an income by selling some of their capital gains, so dividend investing is becoming something of a niche activity.
History tells us where over-popular and over-valued markets usually end, and they usually end with a bang. The current US tech bubble hasn’t burst, yet, and I’ll have more to say on that particular bubble in an upcoming review of the S&P 500.
As for the nauseating “Broken Britain” narrative, I’m not a fan. It seems to be a self-serving idea peddled by those who can profit from it, whether they be politicians or media moguls.
The combination of the US tech bubble and “Broken Britain" narrative have led to a steady flow of retail investor cash exiting UK-focused equity funds since the Brexit referendum of 2016. That steady flow turned into a tsunami when the pandemic struck, with outflows increasing from around £1-5 billion per year to around £11-14 billion per year.
Most of the withdrawn funds have gone into bond funds or global equity funds, which is sensible enough, but it isn’t very useful for the UK. It lowers the valuations of UK companies, making it harder and more expensive for them to raise the equity capital they need to expand their operations and invest in Old Blighty.
The good news is that the pace of these outflows has slowed from its peak in 2023, with a mere £238 million withdrawn in February 2026. That’s an annual run-rate of just £2.9 billion, which is back to the pre-pandemic level of outflows, but not yet the regular inflows that were seen before 2016.
With a bit of luck and a bit of good news (for a change), we could see our first post-pandemic year of net inflows into UK equity funds in 2027, and that would, most likely, have a very positive impact on the FTSE 250’s price.
Note: The above fund flow stats are mostly taken from the Investment Association’s Monthly Statistics document.
Where does the FTSE 250 stand relative to its fair value?
It’s one thing to say the FTSE 250's dividend yield is unusually high, or that it's cheaper than the FTSE 100, but that doesn’t mean it’s cheap. After all, the FTSE 100 could be in an enormous bubble, in which case the FTSE 250 could be cheap on a relative basis, but still expensive on an absolute basis.
Fortunately, that doesn’t seem to be the case. As I said in my recent FTSE 100 review, that index is currently trading above fair value, but only by a small fraction. It most certainly is not in any kind of bubble.
Given that the FTSE 250’s valuation is below the FTSE 100’s, that should mean the FTSE 250 is currently trading below fair value, and it is.
The chart below will be familiar to long-standing readers. It shows the FTSE 250 (in black) against a rainbow of valuation ranges, from very cheap (in green, because low valuations are good for future returns) to very expensive (in red, because high valuations are bad for future returns).
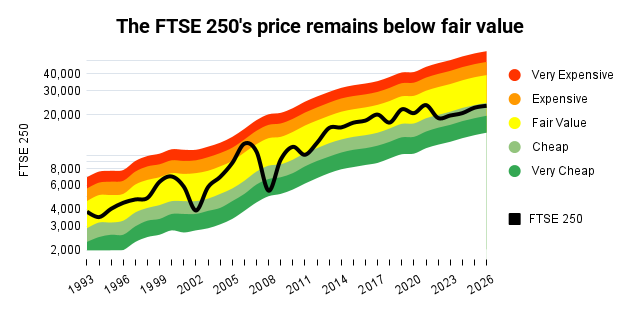
The valuation bands are based on the FTSE 250’s long-term average CAPE ratio. The index is very cheap when CAPE is half its long-term average, fair (yellow) when it’s close to average, and very expensive when it’s double the long-term average.
As you can see from the chart, the FTSE 250 has stayed consistently below the yellow fair value range since the pandemic began, although the degree of undervaluation is small.
More specifically, this model says that the FTSE 250’s fair value stands at 29,325 today, or 29,000 if you’re averse to excessively precise estimates.
With the FTSE 250 at 23,206, it is currently undervalued by about 21%, and since 1993 it has only been this cheap 12% of the time. To put it another way, the FTSE 250 is cheaper than at any time during the last 33 years, other than during the brief post-boom crashes of 2002 and 2009.
I'm going to wrap this article up with a forecast for the year, which is hopefully sensible, but will obviously be wrong as I don’t have a crystal ball.
My simplistic assumption is that the FTSE 250 ends the year precisely at fair value (which is about 29,300). If that were to happen, the FTSE 250’s price would increase by 26% by year-end, and that is my forecast for 2026.
That may seem ridiculously over-optimistic, but over the last 12 months the FTSE 100 has gone up by more than 26%, so perhaps my forecast is not ridiculously over-optimistic after all?
No time for spreadsheets or annual reports?
If you like this article but don’t have hours each month to dig through company accounts, you might find my monthly investment newsletter useful.
Once a month I send out a plain‑English PDF showing:
- The full UK dividend stocks model portfolio
- Which shares I’m buying, selling, trimming or topping up
- The latest news and trading updates for each holding
- Where we are in the stock market valuation cycle
All designed so a UK investor can stay on top of their dividend portfolio in well under an hour a month.
Get the latest blog posts & a free checklist
Get my latest articles in (at most) one email per week and download my dividend investing checklist. Topics usually include:
- Detailed reviews of high-quality UK dividend stocks
- Updates on my UK dividend stocks portfolio
- FTSE 100 and FTSE 250 valuations
- "How to" articles covering all aspects of dividend investing
No spam. Unsubscribe anytime.