Unlike the FTSE 100, the FTSE 250 has put in a pretty decent performance over the last couple of decades.
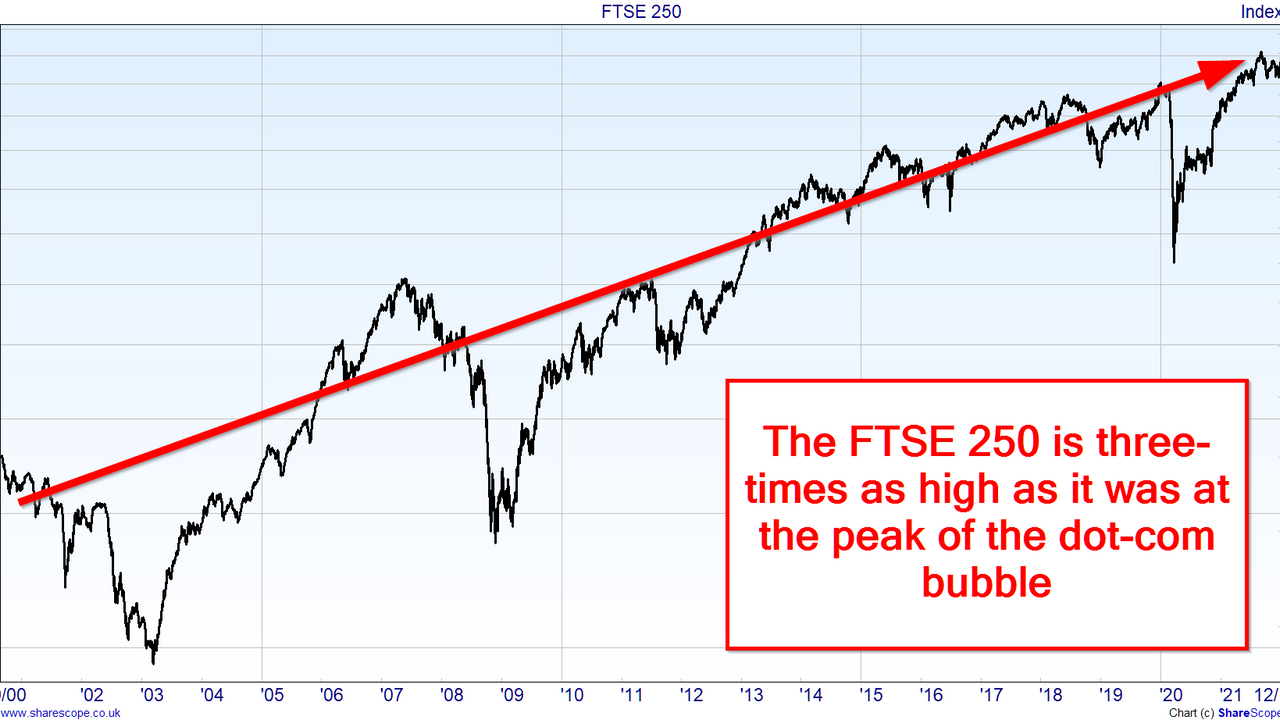
Since it peaked in 2007 (at the end of the early 2000s credit bubble), the FTSE 250 has just about doubled and since its peak in 2000 (at the end of the dot-com bubble) the FTSE 250 has more than tripled.
Given that the FTSE 100 has produced zero capital gains since 1999, a 200+% price increase for the FTSE 250 isn’t too bad at all.
And if you take your starting point as the 2003 low which followed the dot-com bust, the FTSE 250 is up more than 500%.
But have these healthy gains come at the expense of sane valuations? In other words, is the FTSE 250 dangerously expensive?
We can begin to piece together this puzzle by starting at the beginning. In other words, by looking at the FTSE 250’s price and valuation during the dot-com bubble.
Table of Contents
- The dot-com bubble that wasn’t
- FTSE 250, quite contrary, how do your earnings grow?
- FTSE 250 investors are (mostly) a very rational bunch
- Average valuation, average expected returns
- And finally: A few words on dividends
The dot-com bubble that wasn’t
The problem is, the FTSE 250 didn’t really have a dot-com bubble. Let me explain:
Probably the widest-used (and certainly one of the best) market valuation tools is the cyclically-adjusted PE ratio, otherwise known as CAPE. This is similar to the standard price-earnings ratio but it’s incomparably better.
Just like the standard PE ratio, if CAPE is very high relative to historical norms then the index is expensive and if it’s very low… well, you get the idea.
Over the last 30 years or so, the FTSE 250’s CAPE ratio averaged 22. In other words, on average, investors have been willing to pay 22-times the FTSE 250's cyclically-adjusted earnings (ten-year average inflation-adjusted earnings, to be precise).
When dot-com mania gripped investors in 2000, the FTSE 250 peaked at 7,150, giving it a CAPE ratio just shy of 27.
27 is clearly higher than 22, but not that much higher.
- My general rule of thumb (based on decades of data across multiple markets) is that CAPE has to be at least twice its long-term average before you can use the B-word (bubble).
So while 27 is higher than 22, it’s nowhere near 44.
And if you’re favourite valuation tool is the dividend yield, you might want to know that the FTSE 250’s yield in 2000 was 2.5%, only slightly below its 30-year average of 2.9%.
That's another sign that the FTSE 250 was slightly expensive in 2000, but nowhere near bubble territory.
So now we know that the FTSE 250 wasn't actually in a bubble during the dot-com bubble. It was trading at a mildly elevated valuation and nothing more.
That's all very interesting, but how does it help us value the FTSE 250 today?
It doesn't directly, but it does give us some context.
Remember when I said the FTSE 250's current price is three times the level it reached during the dot-com bubble? That sounds bad, but if the FTSE 250 was never in a bubble then perhaps a 200% or so gain over 20 years isn’t enough to push it into bubble territory today.
It’s a bit like when UK supermarkets started selling baked beans for 1p per can a few years ago. If they raised the price to 3p you could legitimately say they’d tripled the price, just like the FTSE 250 has tripled its price since 2000, but those cans of beans would still be incredibly cheap.
What we need to know then, is how the FTSE 250’s earnings have progressed over those 20 years. If earnings have grown faster than the FTSE 250's price, then despite that price increase, the FTSE 250 would actually be cheaper today than it was in 2000 (not that it was cheap back then, but it wasn’t particularly expensive either).
FTSE 250, quite contrary, how do your earnings grow?
(apologies for butchering the original poem)
By means both fair and foul I have amassed a database of the FTSE 250’s earnings and dividends going back to 1993. By plotting that data from 1999 to today, we can see how the underlying companies have progressed over the years.
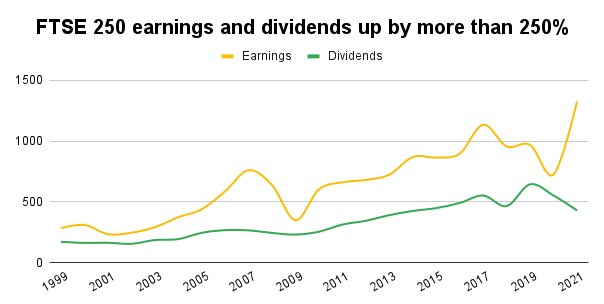
As with the FTSE 100 earnings and dividend chart I wrote about last week, this chart clearly shows the explosion of FTSE 250 earnings during the insanity that was the late 2000s credit boom. You can also clearly see the subsequent crash.
And of course, 2020 and 2021 have been unpleasantly volatile, with dividends going down and earnings stalling and then heading temporarily into the stratosphere.
But here's the important point. Since the turn of the millennium, the FTSE 250 has just got on with the job of growing its earnings and dividends, with both increasing by more than 250% over those 22 years.
So we now have two key pieces of information:
(1) The FTSE 250 began the 21st century with a surprisingly reasonable CAPE ratio, given the bubbles that were engulfing the FTSE 100 and S&P 500 (not to mention the NASDAQ and others).
(2) Since then the FTSE 250’s price has gone up more than 200%, but its earnings and dividends have gone up more.
Let’s bring those pieces together and see what conclusions we can draw about the FTSE 250’s current valuation.
FTSE 250 investors are (mostly) a very rational bunch
The chart below shows how the FTSE 250 has grown over the last 30 years, through the dot-com boom/bust, the credit bubble/crunch and the covid-crash of 2020 (which was so short it doesn’t even show up on the chart because the chart uses year-end prices):
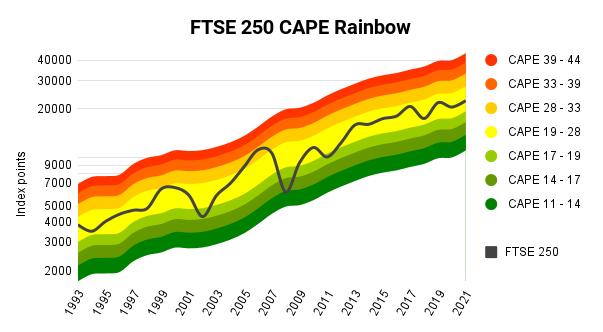
The somewhat psychedelic rainbow tracks the index’s cyclically-adjusted earnings and tells us where the index was on the CAPE spectrum at any given moment.
- Yellow is the fair value zone, where CAPE is close to its long-term average.
- Green is the cheap zone, where the FTSE 250 is anything up to 50% below fair value according to its CAPE ratio (we went deep into this zone during the 2009 financial crisis; note the excellent subsequent returns from this low point).
- Red is the danger zone, where CAPE is up to 100% above normal levels. This is where the FTSE 100 got to in 2000, and it's where the S&P 500's CAPE is today. This is bubble-land.
Here’s my reading of that chart:
The FTSE 250 has increased, somewhat lumpily as equities are wont to do, but largely in line with its cyclically-adjusted earnings. At no point in the last 30 years has it been laughably expensive, and only once has it been mouth-wateringly cheap.
For almost all of those 30 years, the FTSE 250’s price has been extraordinarily close to its CAPE-based fair value.
- With a current CAPE ratio of 22.4, the FTSE 250 is still very close to that fair value.
Not convinced? Okay, let's look at the FTSE 250's dividend yield.
At today's price of 22,250, the FTSE 250’s dividend yield is a measly 1.9%. That’s sub-par relative to its 30-year average yield of 2.9%, but that's because dividends are depressed thanks to COVID-19.
My guess is that dividends will rebound sooner rather than later, and when they do recover to pre-covid levels, the FTSE 250 will have a dividend yield of 2.9% if it remains at today's price of 22,250. That is literally bang-on its 30-year average.
If that isn't pretty strong supporting evidence that the FTSE 250 is close to fair value then I don't know what is.
Of course, at the individual company level, there will still be many horrendously expensive stocks as well as those that are perplexingly cheap. But in aggregate, the FTSE 250 is doing a very good impression of a reasonably efficient stock market.
Average valuation, average expected returns
With the FTSE 250's valuation close to historical norms, it's reasonable to assume that future returns will also be close to historical norms.
A back-of-the-envelope estimate of those future returns would be:
- Long-term earnings and dividend growth of around 6.5% per year, plus
- Dividend yield of 2.9%, giving a
- Total return estimate of 9% annualised (rounded down to be conservative)
I think 9% may be a bit optimistic, but of course, nobody really knows. However, I do think that high single-digit returns over the next ten years and beyond is a realistic and conservative estimate for the FTSE 250.
And finally: A few words on dividends
It has been pointed out that my market valuations don't include dividends. And that's true. It's also deliberate because I typically value markets in price-earnings terms, and dividends aren't relevant in that context.
But of course, dividends aren’t irrelevant. They’re absolutely central to my approach to investing and possibly yours too.
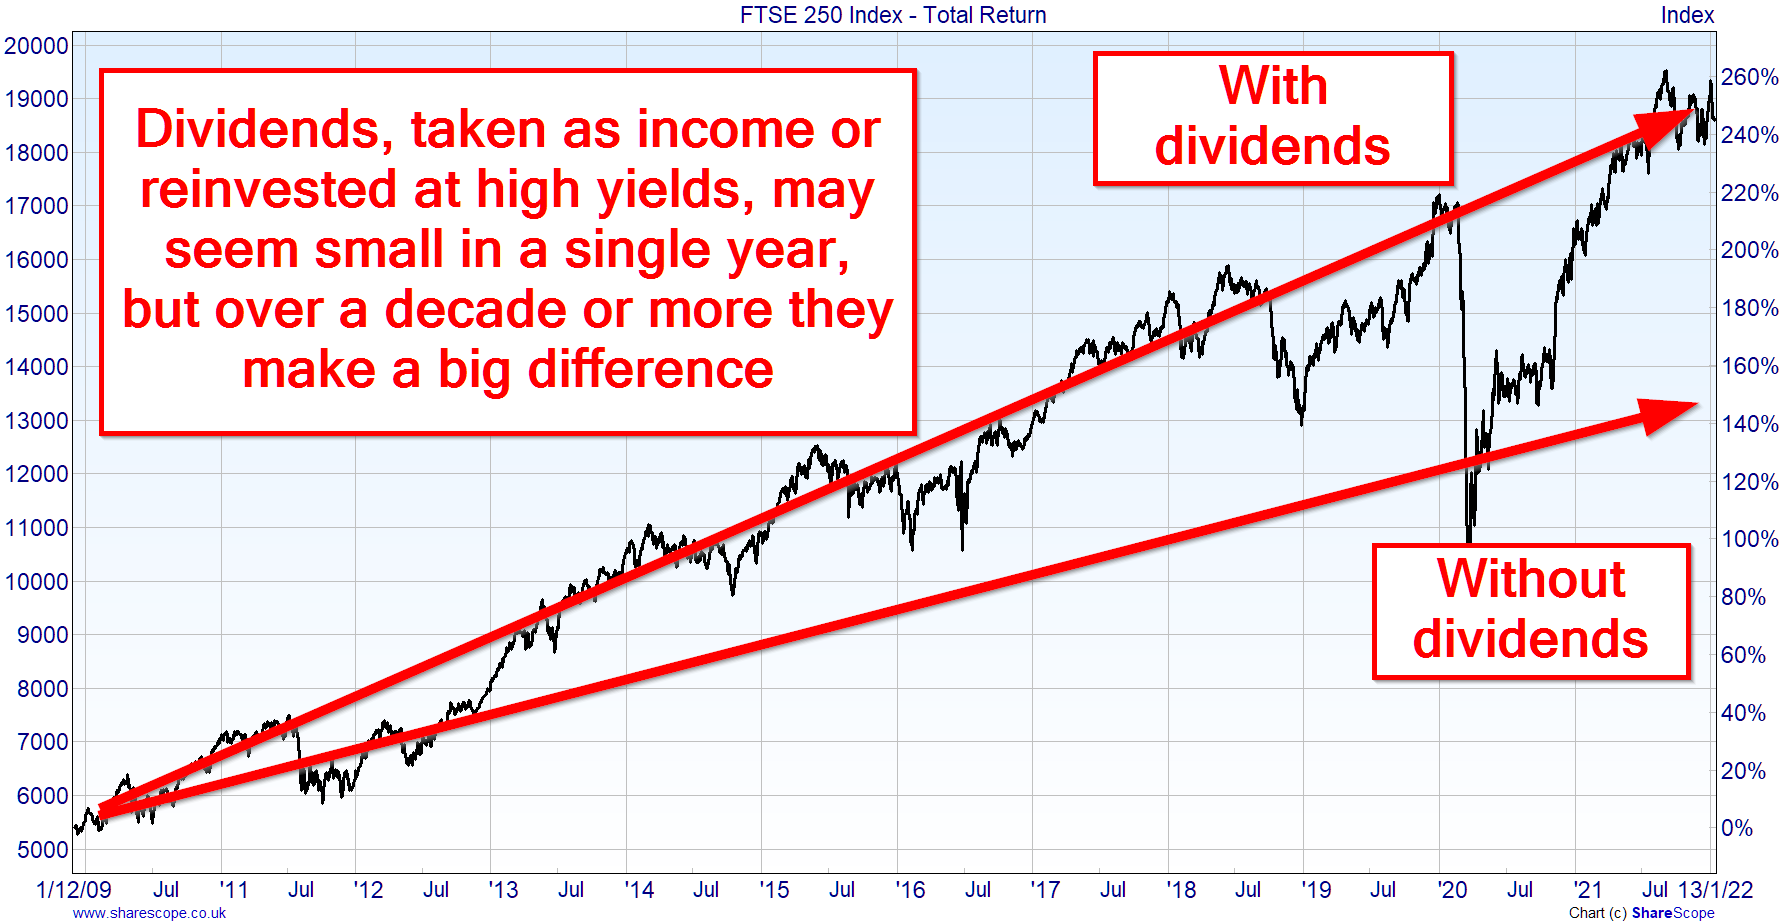
So lest we forget the importance of dividends to our overall returns, here's a chart showing how the FTSE 250 total return index (which includes dividends) has beaten the vanilla FTSE 250 index (which doesn't) by 100% over the last 12 years or so:
No time for spreadsheets or annual reports?
If you like this article but don’t have hours each month to dig through company accounts, you might find my monthly investment newsletter useful.
Once a month I send out a plain‑English PDF showing:
- The full UK dividend stocks model portfolio
- Which shares I’m buying, selling, trimming or topping up
- The latest news and trading updates for each holding
- Where we are in the stock market valuation cycle
All designed so a UK investor can stay on top of their dividend portfolio in well under an hour a month.
Get the latest blog posts & a free checklist
Get my latest articles in (at most) one email per week and download my dividend investing checklist. Topics usually include:
- Detailed reviews of high-quality UK dividend stocks
- Updates on my UK dividend stocks portfolio
- FTSE 100 and FTSE 250 valuations
- "How to" articles covering all aspects of dividend investing
No spam. Unsubscribe anytime.