Investors as a group are as pessimistic and afraid as they've been for a long time.
Many investors are willing to sell at almost any price to escape these negative feelings, and that has pushed the FTSE 250 down more than 20% (the standard definition of a bear market) from its late 2021 peak.
Despite all this fear, bear markets are actually good for long-term investors because bear markets cause an index's price to fall much further than its intrinsic or fair value.
That's because fair value is based on an index's ability to pay dividends over many decades, and a one or two-year recession will have little impact on dividends paid five, ten or twenty years from now.
So in the rest of this post, I'm going to compare the FTSE 250's now much lower price to an estimate of its fair value, to see what that implies for the index's expected returns over the next decade.
Contents
- What is fair value for the FTSE 250?
- What sort of returns should FTSE 250 investors expect over the next decade?
- The FTSE 250 is currently more attractive than either the FTSE 100 or S&P 500
What is fair value for the FTSE 250?
The first thing we need to do is work out what the FTSE 250's fair value actually is, because fair value, also known as intrinsic or investment value, is the single most important number in investing.
Here's a quote explaining why, from John Burr Williams in his seminal 1938 book, The Theory of Investment Value:
"Intrinsic Value, defined as the present worth of future dividends, or of future coupons and principle, is of practical importance to every investor because it is the critical value above which he cannot go in buying or holding, without added risk.
If a man buys a security below its investment value he need never lose, even if its price should fall at once, because he can still hold for income and get a return above normal on his cost price; but if he buys it above its investment value his only hope of avoiding a loss is to sell it to someone else who in turn must take the loss in the form of insufficient income.
Therefore, all those who do not feel able to foresee the swings of the market and do not wish to speculate on mere changes in price must have recourse to estimates of investment value to guide them in their buying and selling."
- John Burr Williams, The Theory of Investment Value, 1938
The standard approach to estimating fair value is to model an investment's future dividends and then calculate their present value based on your target rate of return (in other words, to build a discounted dividend model).
That is exactly how I value companies, but for indices, I use the CAPE ratio (cyclically adjusted PE) instead, partly because CAPE is commonly used to value indices and partly because I've been using CAPE for well over a decade and I know it's a good valuation tool.
For the uninitiated, CAPE is the same as the standard PE ratio, but instead of comparing the index's price to last year's earnings, it compares price to the ten-year average of inflation-adjusted earnings. By averaging earnings over a ten-year period, we get a very stable figure to compare prices against, and this is similar in nature to the stable figure we would get from a dividend model based on long-term dividends.
Fair value is simply the price at which the FTSE 250's CAPE ratio equals its long-term average. Also, the higher CAPE rises above average the more expensive the index becomes, and the further CAPE falls below average the cheaper the index becomes.
So, what is the FTSE 250's long-term average CAPE ratio?
The chart below shows the evolution of the FTSE 250's CAPE ratio over the last 30 years. While 30 years isn't very long, the period from 1993 does cover booms and busts, so it should be reasonably representative of the longer term.

This chart shows exactly what you should expect to see: CAPE goes up and down but tends to stay fairly close to its long-term average.
For example, we can see that the FTSE 250's CAPE was above average in the dot-com bubble of the late 1990s, but not by much. It was actually significantly more expensive in the late 2000s credit bubble which eventually led to the global financial crisis. As that crisis unfolded, the FTSE 250 fell into a severe bear market and its CAPE ratio fell a long way below average, implying that the FTSE 250 was very cheap in 2009 (which with hindsight it was).
The red line in the chart shows the average CAPE for the period, set at 22.
Note: For the keen-eyed among you, you may have spotted that the red line is actually below the middle of the blue line. That's because the true average CAPE for the last 30 years is 24, not 22. However, based on data from other indices (primarily the S&P 500, which has a 100-year average CAPE of 18) I think 24 is probably slightly higher than the true long-term average. In other words, if I had data going back to the 1950s then I suspect that the average CAPE would be lower than 24, so to err on the side of caution I assume the average is 22.
Now that we know CAPE's long-term average, we can calculate fair value as soon as we work out what the FTSE 250's cyclically adjusted earnings are.
To do that we'll need to know its earnings in previous years, so here's a chart showing the FTSE 250's earnings and dividends over the last 30 years.

As you can see, earnings and dividends tend to go up over time, thanks to inflation and real economic growth. This is what moves the market upwards over the long term. Over the shorter term, earnings are volatile and earnings volatility drives short-term price volatility in the stock market.
Using data from the chart above, I can tell you that the FTSE 250's cyclically adjusted earnings come to 1,075 index points.
If we multiply that by CAPE's long-term average of 22, we can estimate fair value:
- The FTSE 250's CAPE-based fair value is 23,700
As I write, the FTSE 250's price is 19,100, so it's about 20% below fair value and that's good news because it means the index is slightly cheap.
For context, in most cases CAPE doesn't fall more than 50% below its average or rise more than 100% above its average, so being 20% below is comfortably within that expected range.
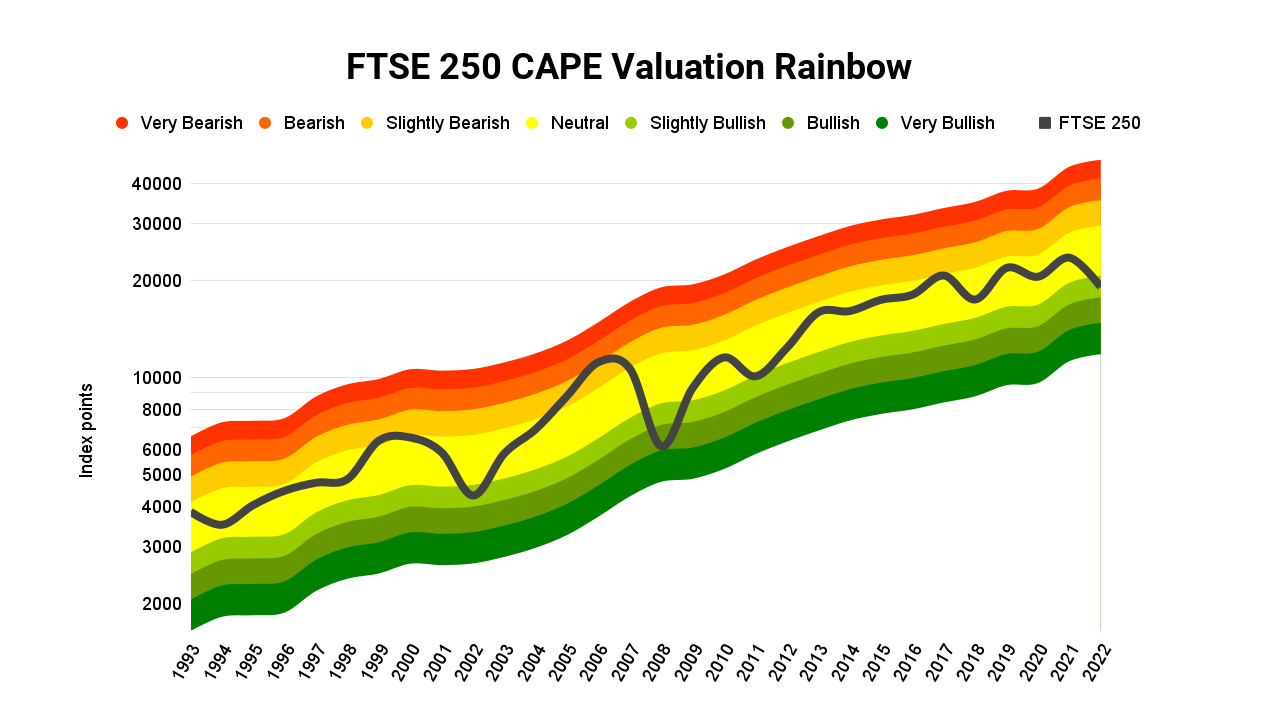
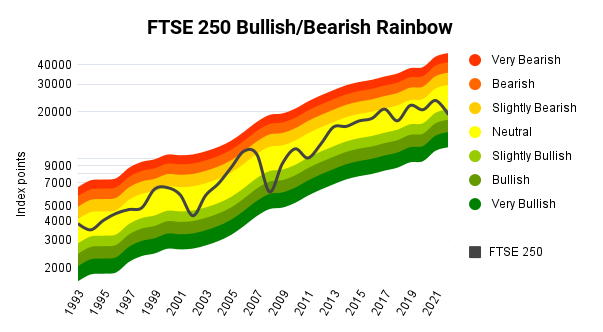
To help you visualise that range, here's a chart showing the FTSE 250 over the last 30 years, superimposed over the range of values that fit within that half-average CAPE to double-average CAPE range.
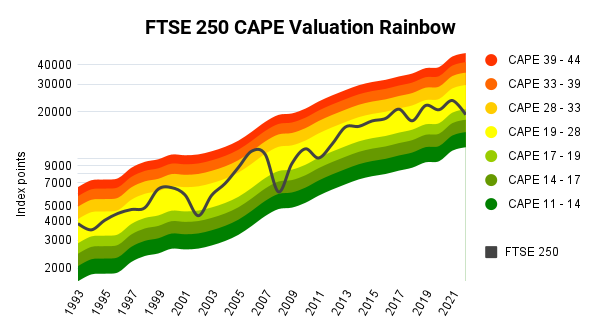
If you haven't seen this chart before, here's a brief explainer. If the FTSE 250 is in the:
- Red: CAPE is close to double the average and the index is expensive
- Yellow: CAPE is close to average and the index is close to fair value
- Green: CAPE is close to half the average and the index is cheap
This chart tells us that the FTSE 250 has spent most of the last 30 years fairly close to its mean valuation. In contrast, the FTSE 100 reached the upper limits of that range in the dot-com bubble and the S&P 500 exceeded the upper limits of that range in both the dot-com bubble and the most recent "super-bubble".
You can see the current bear market at the far right of the chart, where the FTSE 250 has just started to move into the green zone, which I would describe as slightly cheap.
If I wanted to be negative, I would say that the FTSE 250 is only slightly into that green zone, so from a historical perspective it could have a long way to fall in the short-term.
But I'm a long-term investor and I'm not really that interested in what happens in the short-term. I think it's much more important to have a longer-term view focused on the performance we might reasonably expect over the next ten years, and that's what I want to look at next.
What sort of returns should FTSE 250 investors expect over the next decade?
I said earlier that the FTSE 250's below-average valuation was good news. Here's why:
First, a below-average valuation usually produces an above-average dividend yield, and that's true today. The FTSE 250's dividend yield has averaged 3% over the last 30 years and yet today it stands at 3.6%. That gives us an expected 0.6% boost to annualised returns in the years ahead.
Second, valuations tend to revert to their long-term average over time. So, with the FTSE 250's valuation below average, we can reasonably expect an upward re-rating at some point over the next decade, and that would also add to our expected returns.
This is why bear markets and depressed valuations are good news for long-term investors, as long as you don't have to sell any of your investments at those depressed prices.
Let's get a little more specific, by donning our prognosticator's hat and gazing into our crystal ball in order to build a baseline scenario for future returns.
To estimate returns over the next ten years, all we need to do is estimate the growth rate for earnings and dividends, and estimate where CAPE will be at the end of that period.
For earnings and dividend growth, we can draw upon the historical record.
Over the last 30 years, the FTSE 250's cyclically adjusted earnings have grown by 7% per year, which is very impressive. Dividends have grown slightly slower, by 6% per year, leading to a higher level of dividend cover today than in 1993.
I'm going to be slightly conservative by assuming that future earnings and dividends grow by 5% per year, rather than the historical 6% or 7%. This will give us a margin of safety in case the future isn't quite as bright as the past.
Using that 5% growth rate, we get the following scenario:
- The FTSE 250's cyclically adjusted earnings grow from 1,075 index points today to 1,752 in 2032
- The FTSE 250's dividend grows from 689 index points today to 1,122 in 2032
As for CAPE, since we have little idea where it will be, other than that it's very likely to be somewhere between half and double its long-term average, the most conservative thing to do is to assume it will be equal to its long-term average of 22.
Now that we have an estimated value for CAPE, we can easily work out where the FTSE 250 would be, under this scenario, in 2032:
- The FTSE 250's price grows from 19,100 today to 38,500 in 2032
Taken together, this scenario gives us the following results:
- The FTSE 250 produces a 48% return from dividends by 2032
- It produces a capital gain of 102% by 2032
- It produces a total return of 150% or 10.7% annualised between 2022 and 2032
An expected annualised return of 10.7% is relatively good and that's largely down to the above-average starting dividend yield and the assumption that CAPE will revert to its mean by 2032.
Given that the expected return is slightly above average, I would describe myself as slightly bullish on the FTSE 250 over the medium term (to 2032).
Please note that I'm not saying the FTSE 250 will produce these results. That would be ridiculous. Earnings and dividend growth could be slightly faster or slower than the above and CAPE could be significantly higher or lower than 22 (although almost certainly between 11 and 44).
This is simply a baseline scenario or central projection which represents the expected return, which will inevitably differ from the actual return (although hopefully not by too much).
The FTSE 250 is currently more attractive than either the FTSE 100 or S&P 500
With a conservative scenario giving expected returns of almost 11% annualised over the next decade, the FTSE 250 does seem to me to be the pick of the bunch of the major indices that I keep a close eye on.
The FTSE 100 has the same dividend yield as the FTSE 250, but under a similar scenario to the one above, its expected return to 2032 comes out at 9.5% versus 10.7% for the FTSE 250. Here's the related FTSE 100 CAPE valuation article.
As for the S&P 500, despite recent declines, it has a tiny dividend yield of just 1.6% and its CAPE ratio is 28, compared to a long-term average of 18. Again, under a similar scenario to the one above, the S&P 500's expected annualised return to 2032 is a feeble 2.3%, thanks to a small dividend yield and an expected CAPE de-rating. Here's the related S&P 500 CAPE valuation article.
No time for spreadsheets or annual reports?
If you like this article but don’t have hours each month to dig through company accounts, you might find my monthly investment newsletter useful.
Once a month I send out a plain‑English PDF showing:
- The full UK dividend stocks model portfolio
- Which shares I’m buying, selling, trimming or topping up
- The latest news and trading updates for each holding
- Where we are in the stock market valuation cycle
All designed so a UK investor can stay on top of their dividend portfolio in well under an hour a month.
Get the latest blog posts & a free checklist
Get my latest articles in (at most) one email per week and download my dividend investing checklist. Topics usually include:
- Detailed reviews of high-quality UK dividend stocks
- Updates on my UK dividend stocks portfolio
- FTSE 100 and FTSE 250 valuations
- "How to" articles covering all aspects of dividend investing
No spam. Unsubscribe anytime.